
Image by Tambako The Jaguar
Projects are by definition a risky thing. Risk means that it might take longer, they do not meet their goals or will be more expensive than expected. This blog post will describe a simple but effective way of managing and reducing risks.
Especially projects in the IT world are likely to fail. In the last 20 years around 20%-30% of projects failed without delivering any value. Further 30% were challenged meaning they overrun budget or time.
The simple advice in this blog post is:
Do risky things first
So what does this mean? A project is a set of tasks that are normally done in a certain order. The description and ordering of these parts is the project plan. Most of the time there are dependencies between these tasks.
In a well managed project you always know how much effort has already been spend and how much effort is expected to be left. This leads to the delivery date. Further you can always see the critical path.
The critical path is the sub set of tasks that take longest. Meaning that if there are some interruptions on the critical path the whole project will not meet the deadline.
Risk in this context means the probability that a task takes longer than expected or is more expensive. Because we are in software development “time equals money” so we will only elaborate on the time factor.
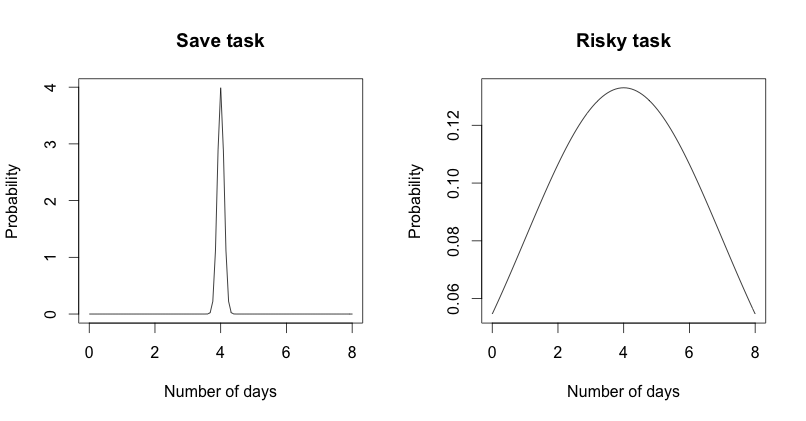
If we execute one tasks multiple times sometimes it will be faster sometimes it will be slower. We can assume a normal distribution where risky tasks have a big standard deviation and save task a small one. See the diagram below for an comparison between risky task and save task.
Lets now illustrate a project plan with integrated standard deviations a.k.a risks.

In the diagram above you see a project plan including the average time and some standard deviation markers. These kind of diagrams are also called box-and-whisker plots. Most of the time they are used for visualizing financial data in a vertical way. Our plot is horizontal.
The big question is how do you know the standard deviation. The answer is easy: From experience. So lets assume you are doing all the time the same kind of projects like introducing an online marketing optimization suite. Around 80% of your project plan will always contain the same tasks. Just measure how long these tasks take and then you can calculate the average and the standard deviation.
If you have a complete new tasks you can just estimate the average and take the standard deviation of all tasks ever done.
From my experience one of the riskiest things is: “Getting accounts”. So for some accounts it takes 20 minutes until we have them. For other accounts it takes up to 2 month until we have them. Further it is often the case that the accounts that we get do not include all the permissions that we need.
So how do you reduce risk now?
This is easy just execute your project. The longer you work and the more risky tasks you complete the more you reduce risk because after completing a task you know how long it took and you do not have to handle anymore the risk.

Bonus paragraph estimating probability of not meeting deadline
If you are serious project manger you would never commit to a deadline. Instead you would always report a certain probability that you will meet the deadline.
Lets assume you have the following table of dependent project task including average time and standard deviation:
| Name | Average duration in days | Standard deviation | Risk level |
|---|---|---|---|
| Task 1 | 3 | 3 | high |
| Task 2 | 3 | 0.2 | low |
| Task 3 | 3 | 1 | moderate |
| Task 4 | 5 | 3 | high |
| Task 5 | 5 | 4 | high |
| Sum | 19 | 11.2 |
The following graph shows the probabilities that the project will be done after a certain amount of time:
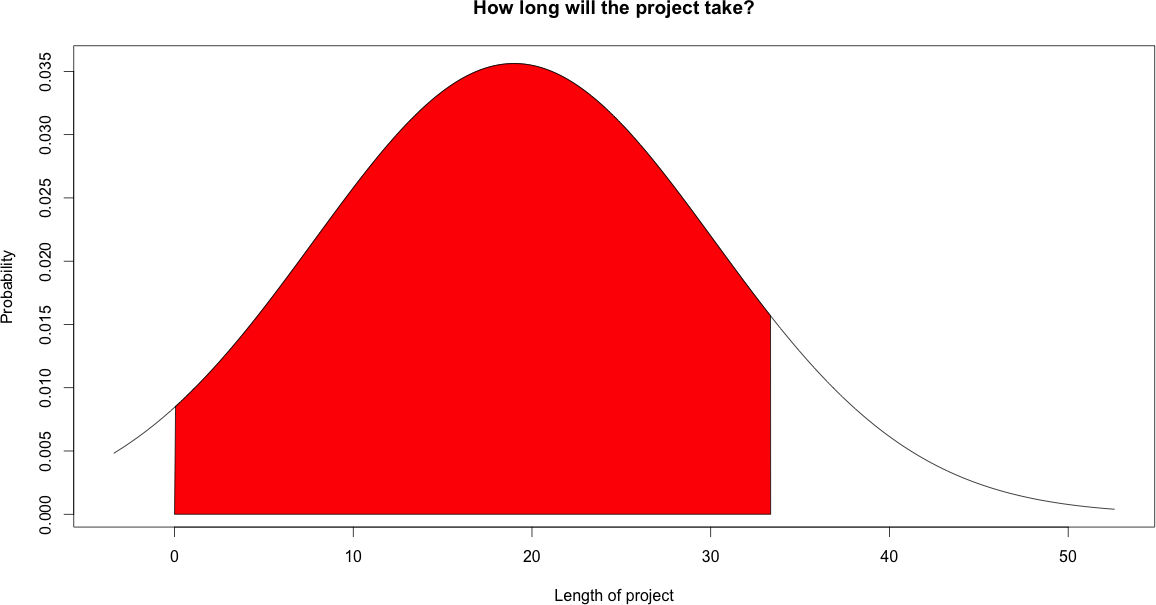
I marked the area after which period the project will be done with 90% probability. After 33.35 days.
If you want to run your projects and marketing campaigns in an efficient and save way contact us.
The following R script was used to generate the plots in this blog post:
# tell R to have 2 plots near each other
layout(matrix(c(1,2), 2, 1, byrow=TRUE))
plot(function (x) dnorm(x-3, 1, 0.1), 0, 8, ylab="Probability", xlab="Number of days", main="Save task")
plot(function (x) dnorm(x-3, 1, 3), 0, 8, ylab="Probability", xlab="Number of days", main="Risky task")
# tell R to have 1 plot near each other
layout(matrix(c(1,1), 1, 1, byrow=TRUE))

# the duration of the tasks
taskDuration <- c(3,3,3,5,5)
# the standard deviation
taskSd <- c(3,0.2,1,3,4)

# the estimated project length (mean)
projectLength <- sum(taskDuration)
sd <- sum(taskSd)
lb <- 0
# the probability that the whole project will be completed
# after this period
probabilityOfCompletness <- 0.9
ub <- qnorm(probabilityOfCompletness, projectLength, sd)

x <- seq(-2,3,length=600)*sd + projectLength
hx <- dnorm(x,projectLength,sd)

plot(x, hx, type="n", ylab="Probability", xlab="Length of project", main="How long will the project take?")

i <- x >= lb & x <= ub
lines(x, hx)
polygon(c(lb,x[i],ub), c(0,hx[i],0), col="red")
qnorm(probabilityOfCompletness, projectLength, sd)
[1] 33.35
Do yo have a software that can allow me to do predictive analytics in project management?
Hi Jaime,
actually we are using normal project management software exporting the data and then using R to do the predictive analysis. If you are interested in details, contact us.
/Manuel