In this blog post I will tell a small data story about farmland prices based on data of 2016. The data is mainly given by Statisches Bundesamt and Bundesanstalt für Geowissenschaften und Rohstoffe and the visualizations are made with the awesome open source library kepler.gl created by Shan He and her data visualization team at Uber.
Overview map in germany in which district was paid how much per hectare
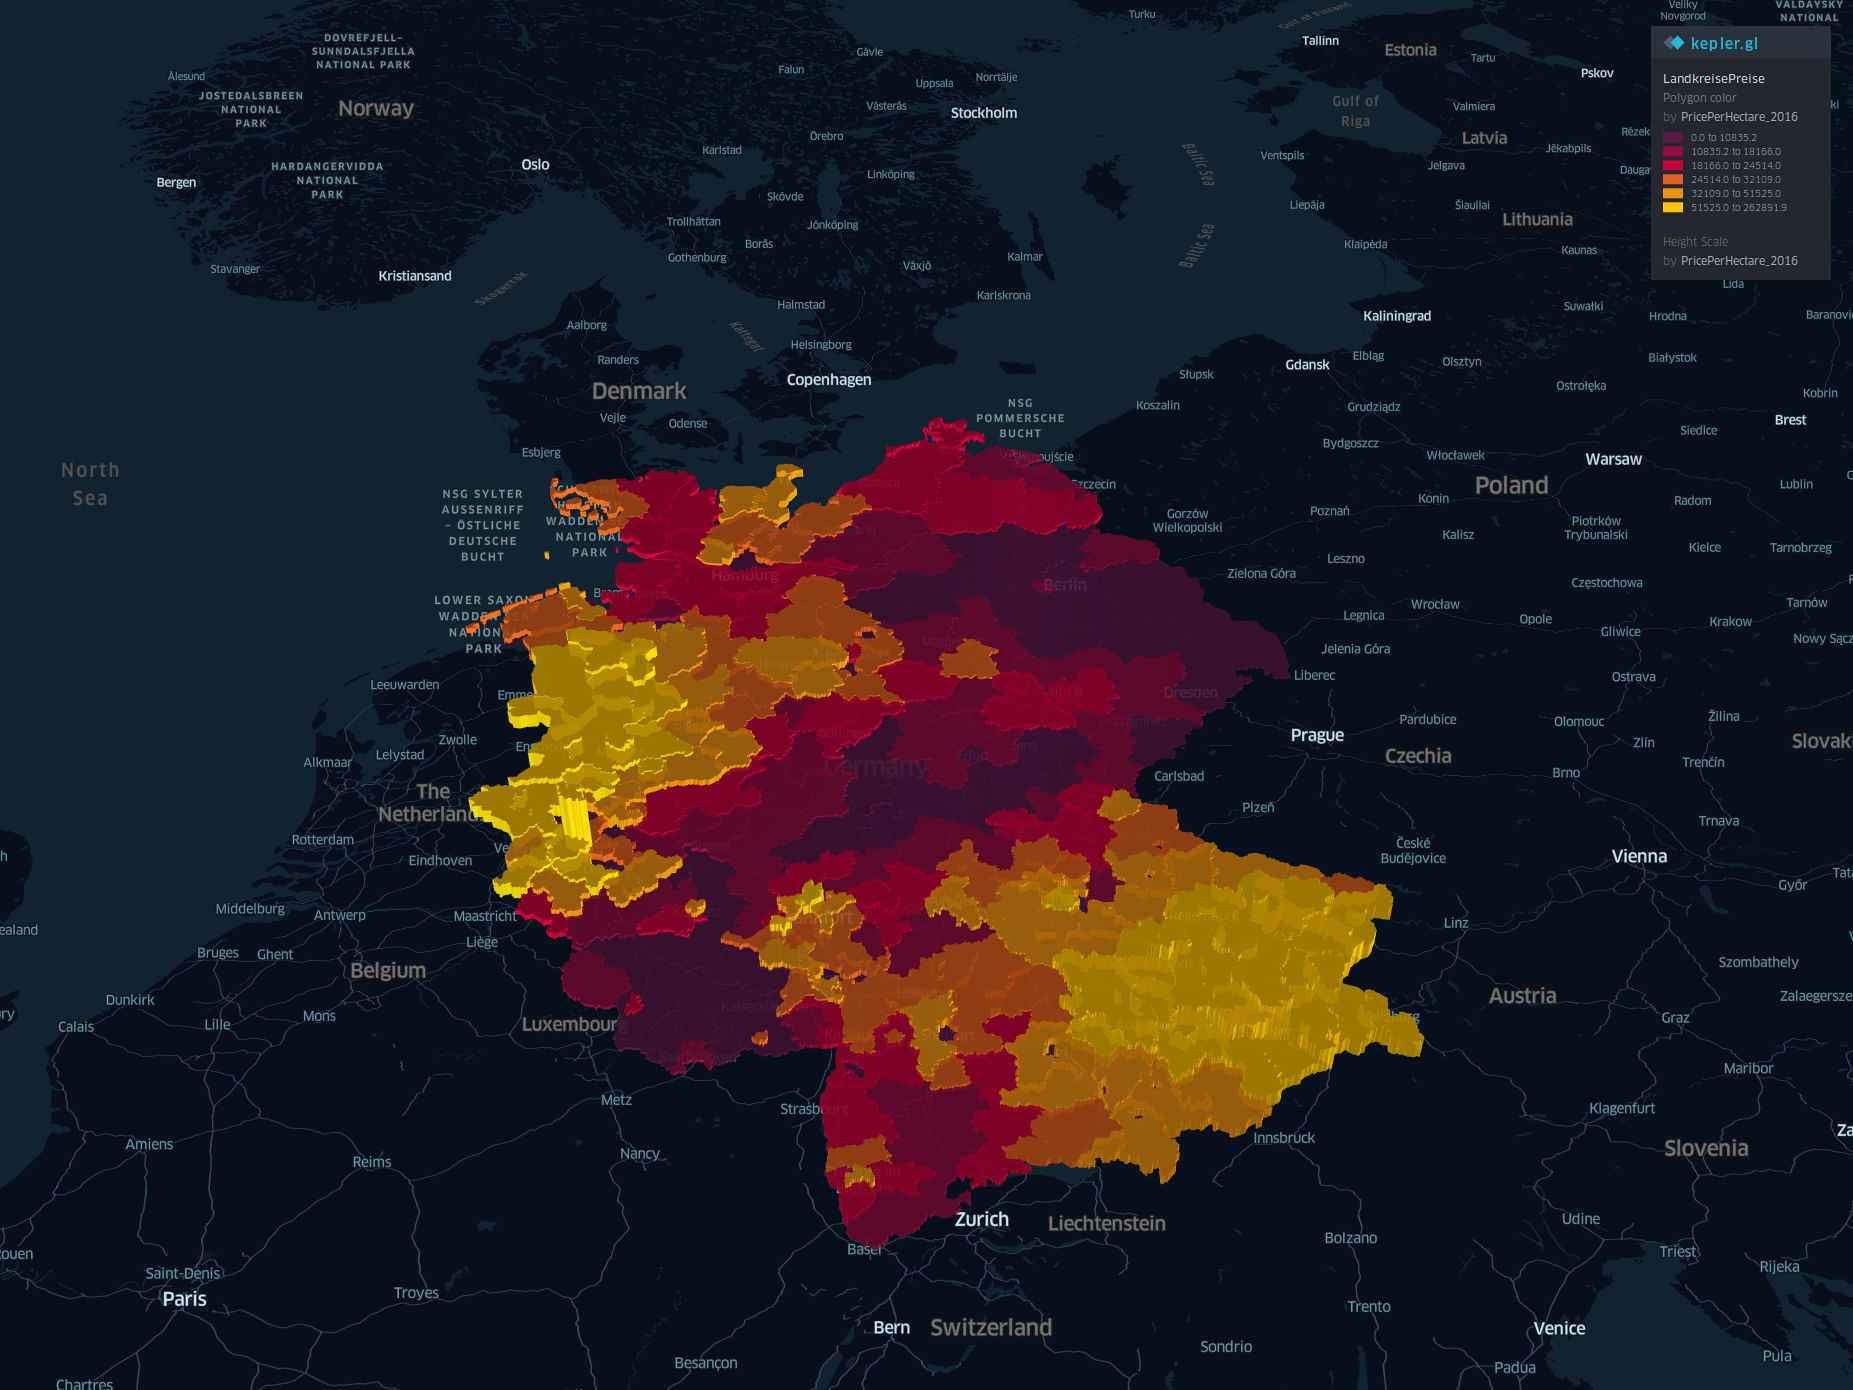
In the image above you can see a 3d visualization of the money that was paid in average for farmland in germany in 2016.
In average 22.310 € was paid for a hectare in 2016. In 2015 we had an average price of 19.614 €. This is an increase of about 15% in one year.
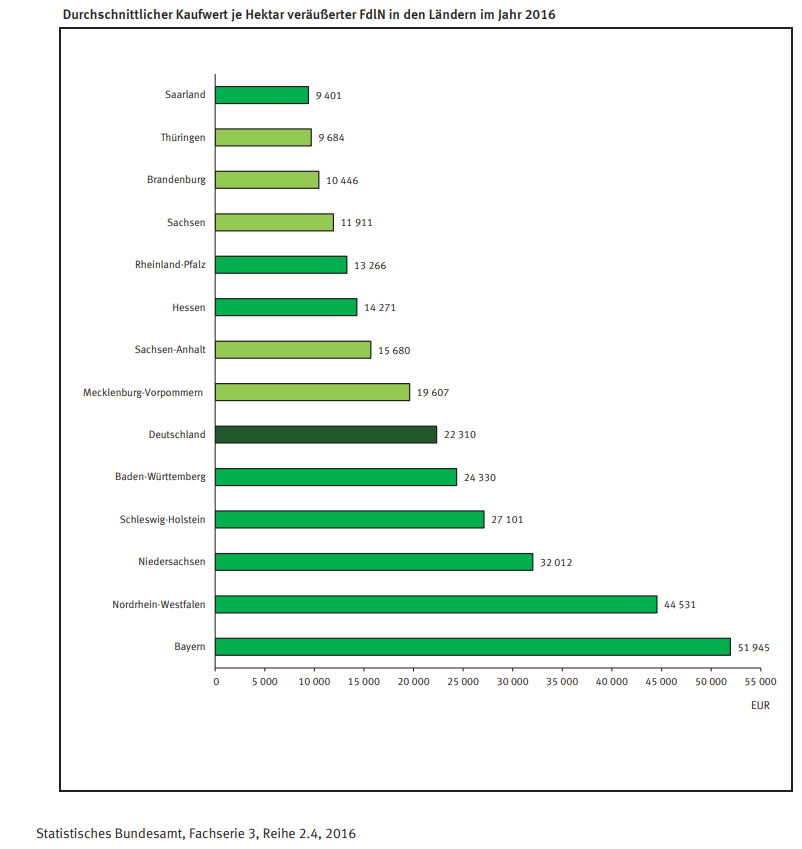
The interesting part is that the variance of the paid price is quite height. The minimum was paid in Saarland with 9 401 €. Further the newly-formed German states have a low price level. The highest priceses are paid in Bavaria, North Rhine-Westphalia and Lower saxony. Details can be seen in the following chart:
Here is the same data but plotted in 2d with just colors
You might think that soil quality and yield potential is the main value driver for prices.
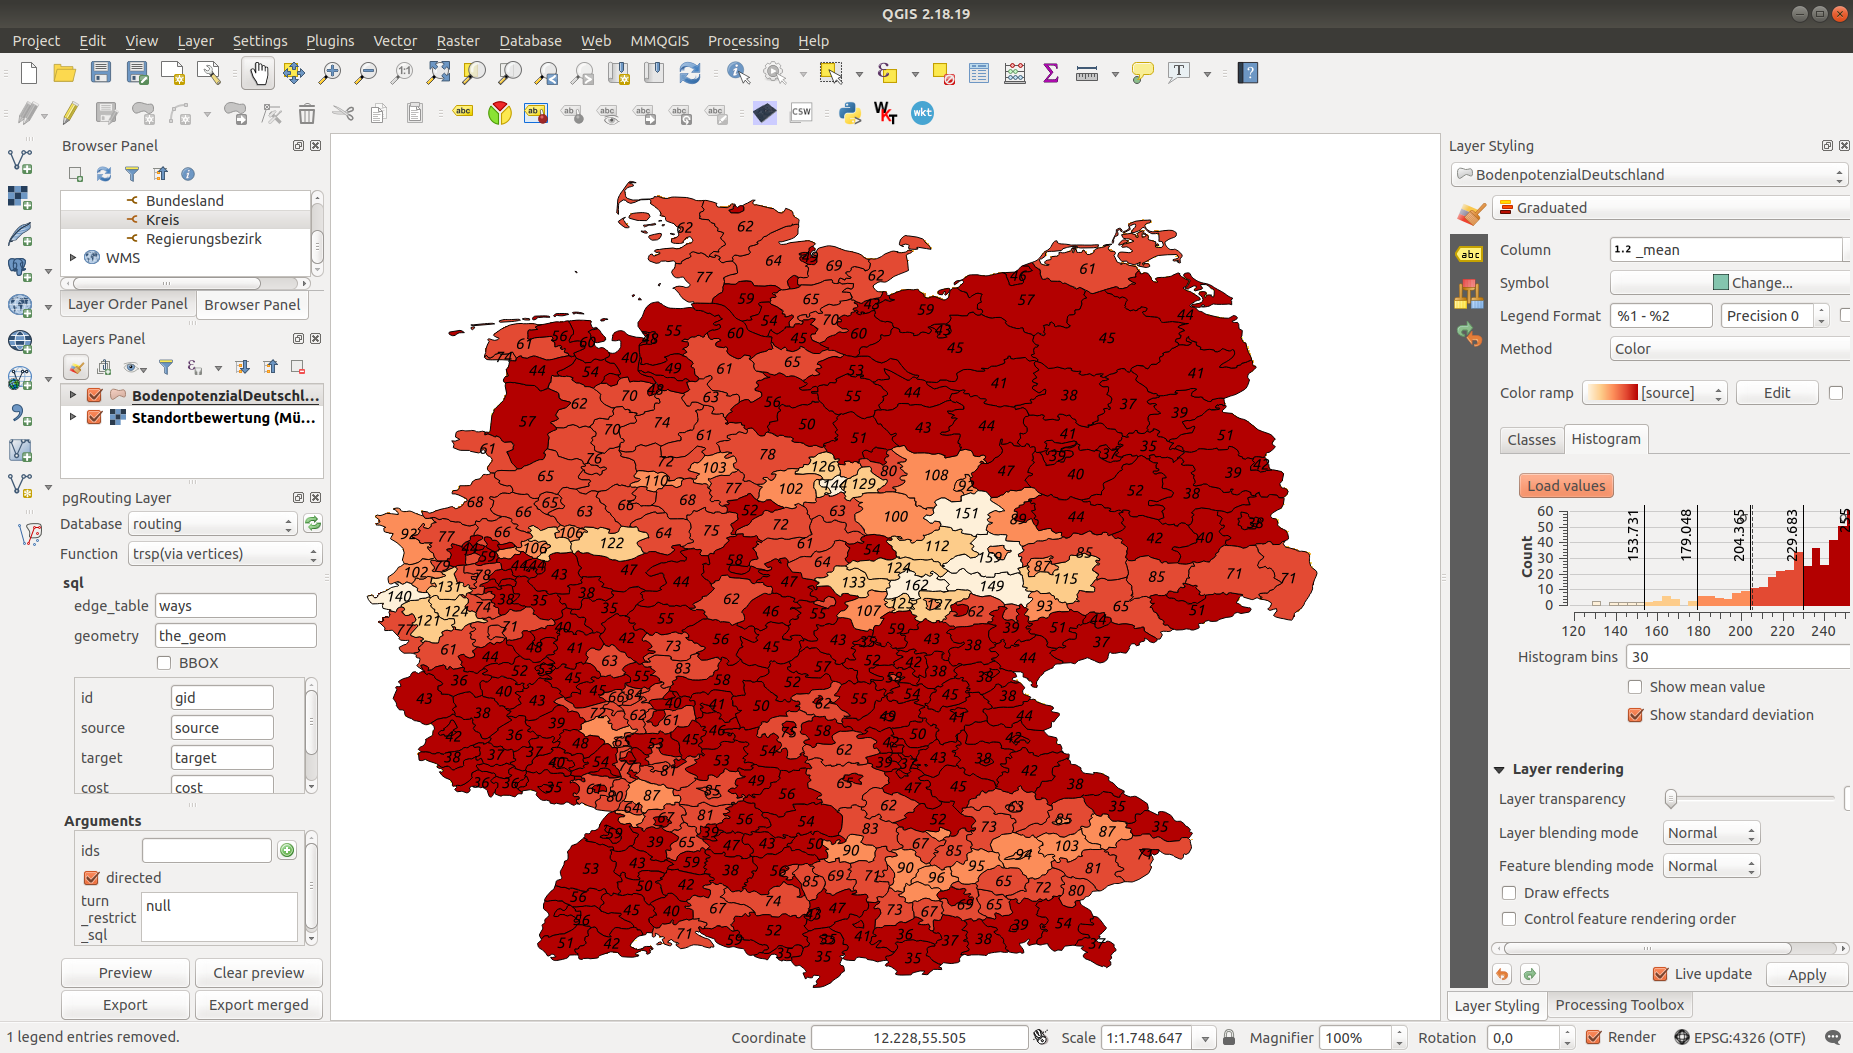
Actually it is not. I did with QGis some aggregations based on the districts in germany and the yield potential. In the image below you can see the soil quality in whole germany based on the SQR 100 scoring model.
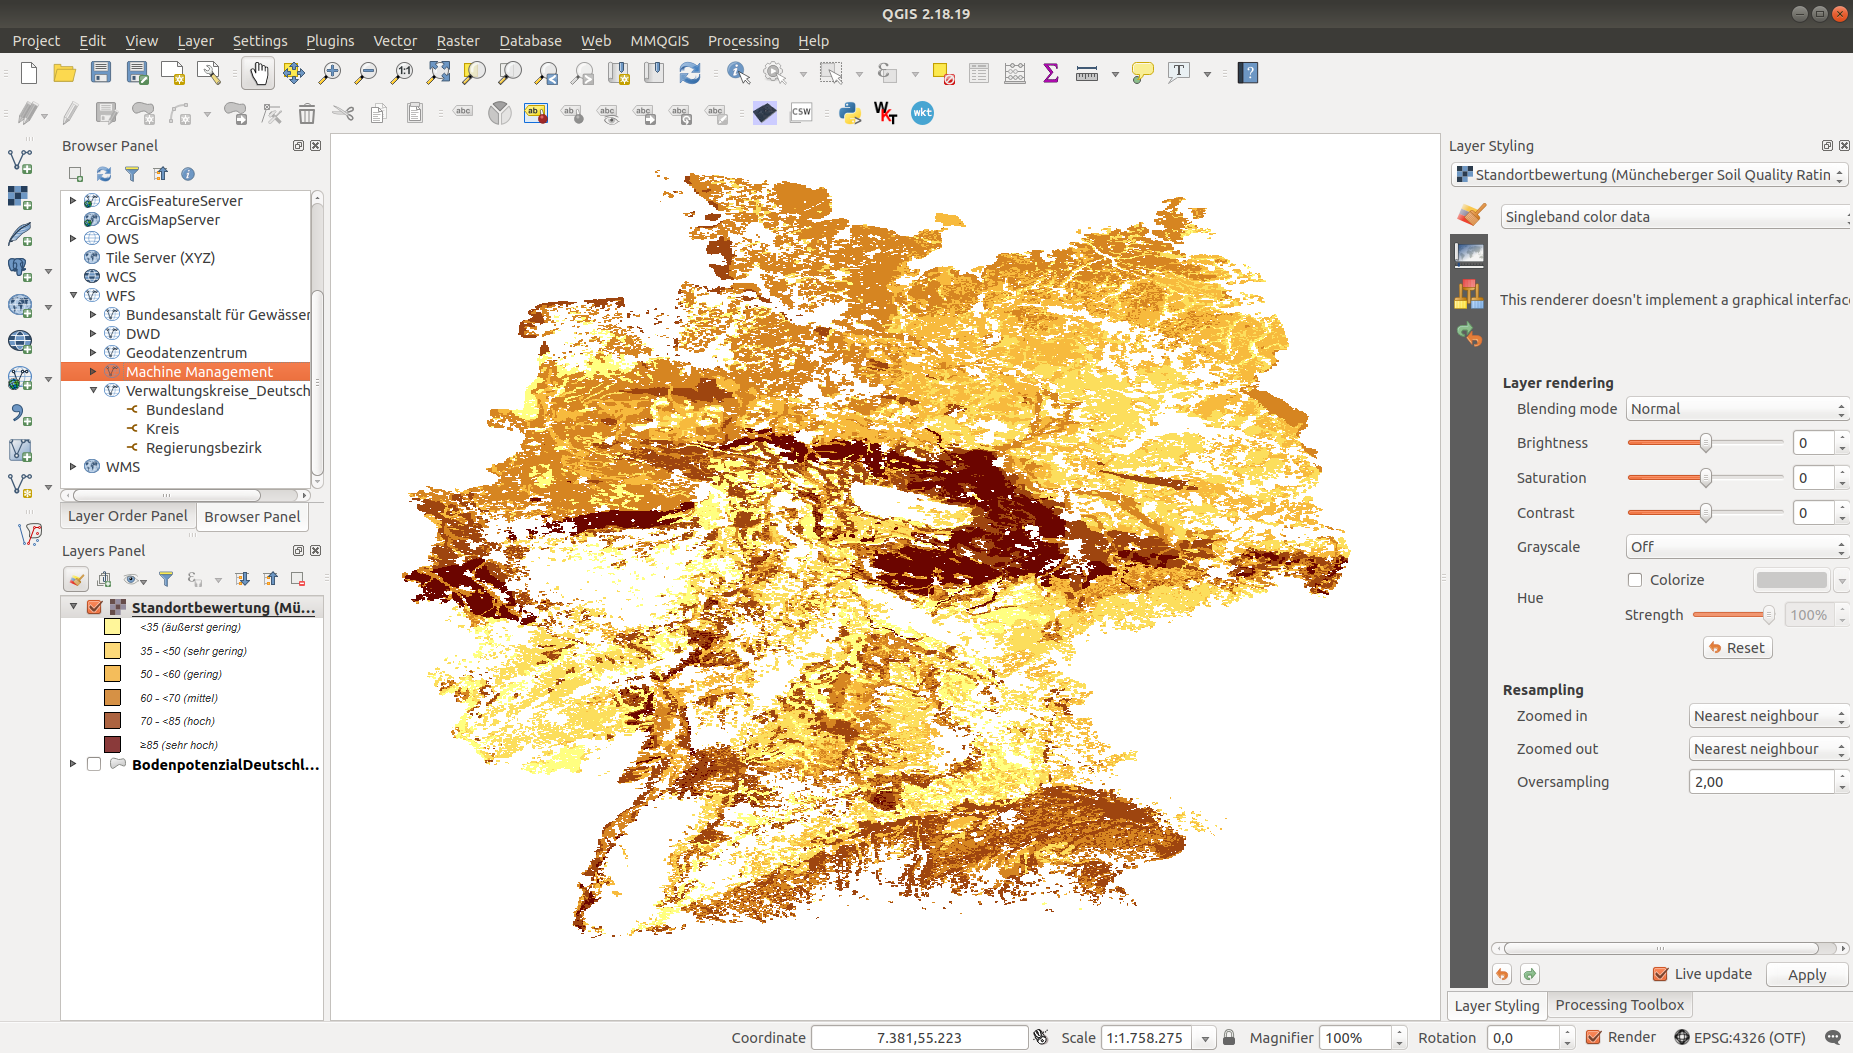
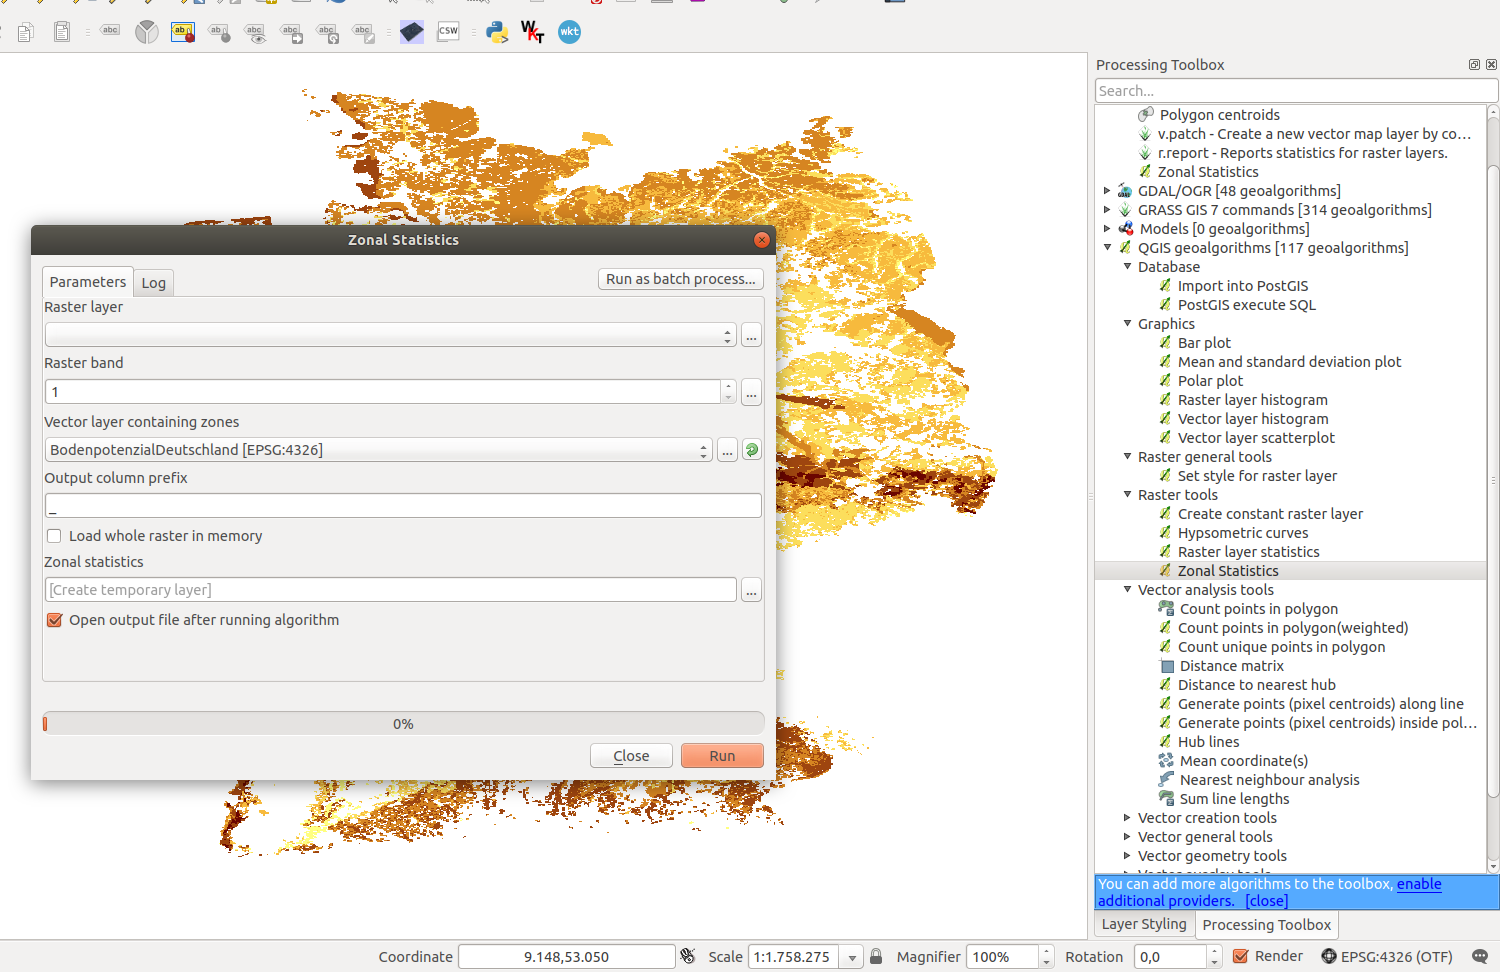
I ran some zonal statistics in QGis on the layer with the german districts as zones.
After running the statistics I had to normalize the mean by adding -285 to it. After doing so with some styling this is how it looks in QGis:
To make it super sexy I exported it as geojson and loaded it into kepler.gl
Overview map of soil quality in germany based on SQR 100 Scoring

Now it is quite obvious that soil quality only accounts for a small part of the market value of farmland. You can see that around Magdeburg there is very good soil but the prices that have been paid are low.
I would guess that the main value driver is speculation that the farmland becomes building ground and can be sold for a magnitude of the price.
Here is the same data but plotted in 2d with just colors
Conclusion
In this blog post I showed how I used kepler.gl and data to tell a short story of valuation of farmland. If you want Incentergy to tell your story to your management or your customers feel free to contact us.
Data sources
- Statistisches Landesamt Schleswig-Holstein
- Statistisches Landesamt Niedersachsen
- Statistisches Landesamt Mecklenburg-Vorpommern
- Statistisches Landesamt Rheinland-Pfalz
- Statistisches Landesamt Brandenburg
- Statistisches Landesamt Thüringen
- Statistisches Landesamt Sachsen
- Statistisches Landesamt Sachsen-Anhalt
- Statistisches Landesamt Hessen
- Statistisches Landesamt Nordrhein-Westfalen
- Statistisches Landesamt Bayern
- Statistisches Landesamt Baden-Württemberg
- Statistisches Landesamt Saarland
- GeoBasis-DE Bundesamt für Kartographie und Geodäsie 2018
- Bundesanstalt für Geowissenschaften und Rohstoffe (BGR): Soil quality rating for cropland in Germany 1:1,000,000 (WMS)