Tag: deck.gl
-
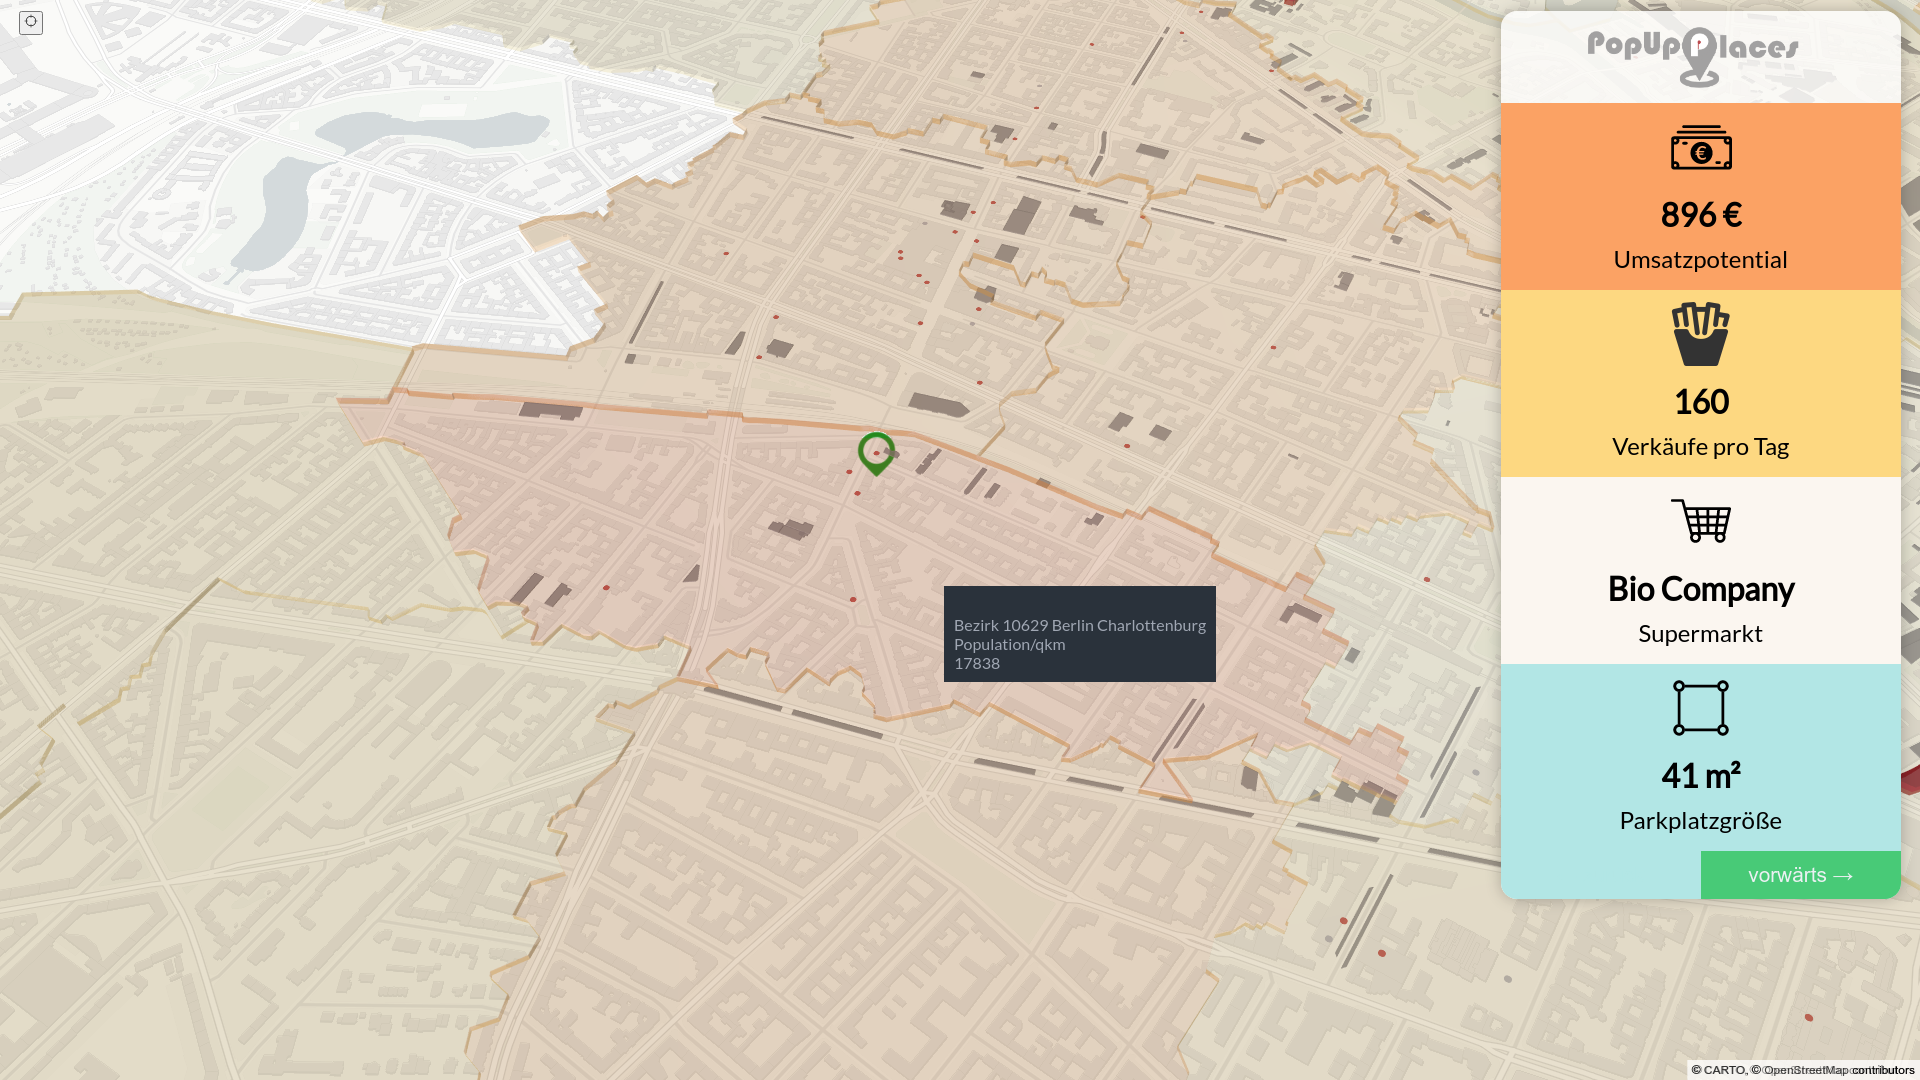
PopUpPlaces – Mob Programming for pop up restaurants app for FarmHack 2020
In this post I want to share some insights about our approach for development and the product that we created for FarmHack 2020. We were a team of 7 people […]
-
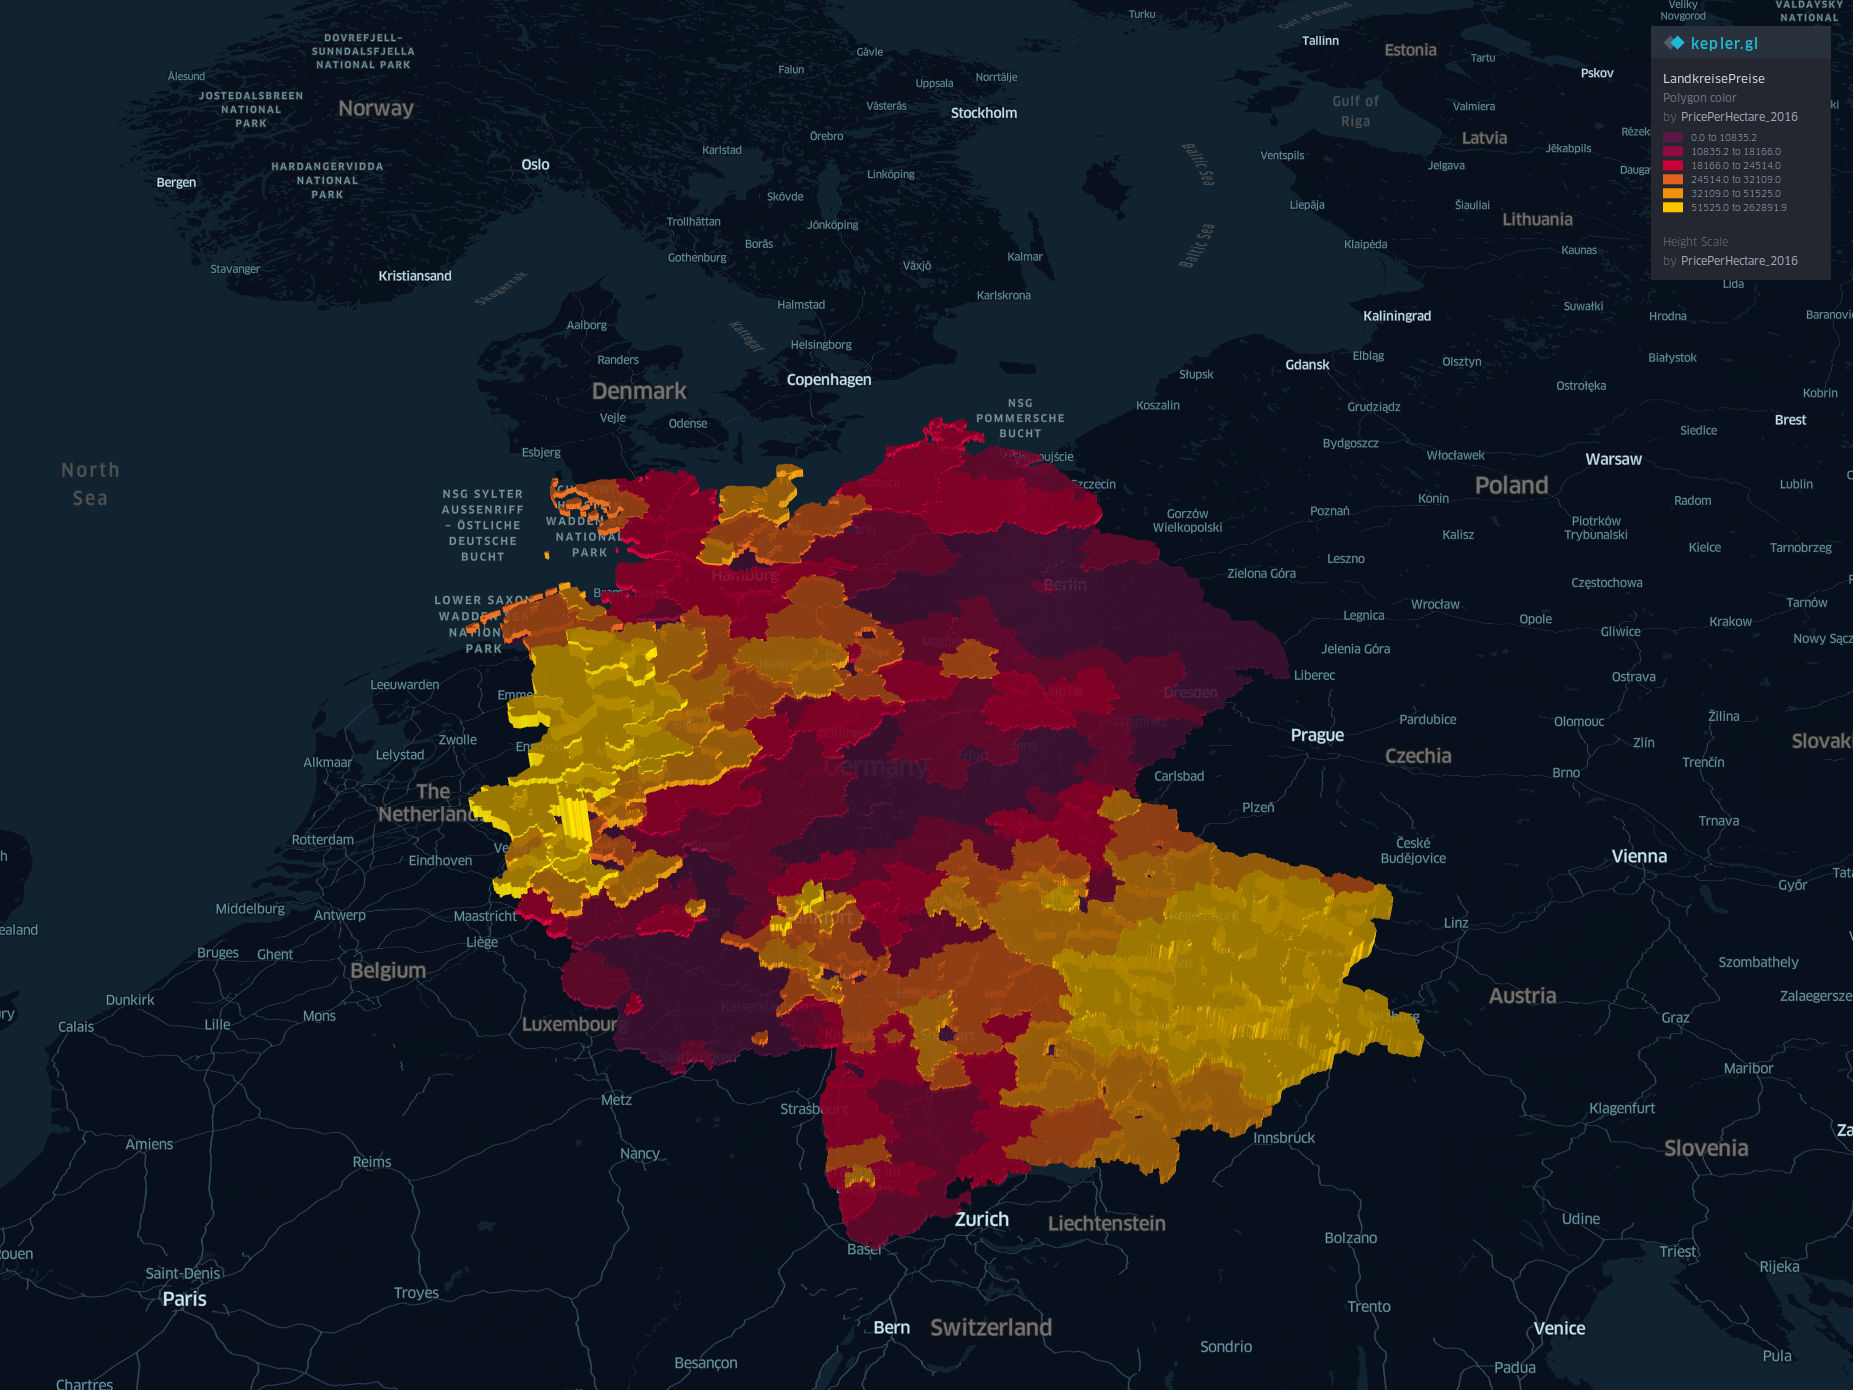
Visualizing farmland property prices in germany based on 2016 sales with kepler.gl
In this blog post I will tell a small data story about farmland prices based on data of 2016. The data is mainly given by Statisches Bundesamt and Bundesanstalt für […]