Tag: kepler.gl
-
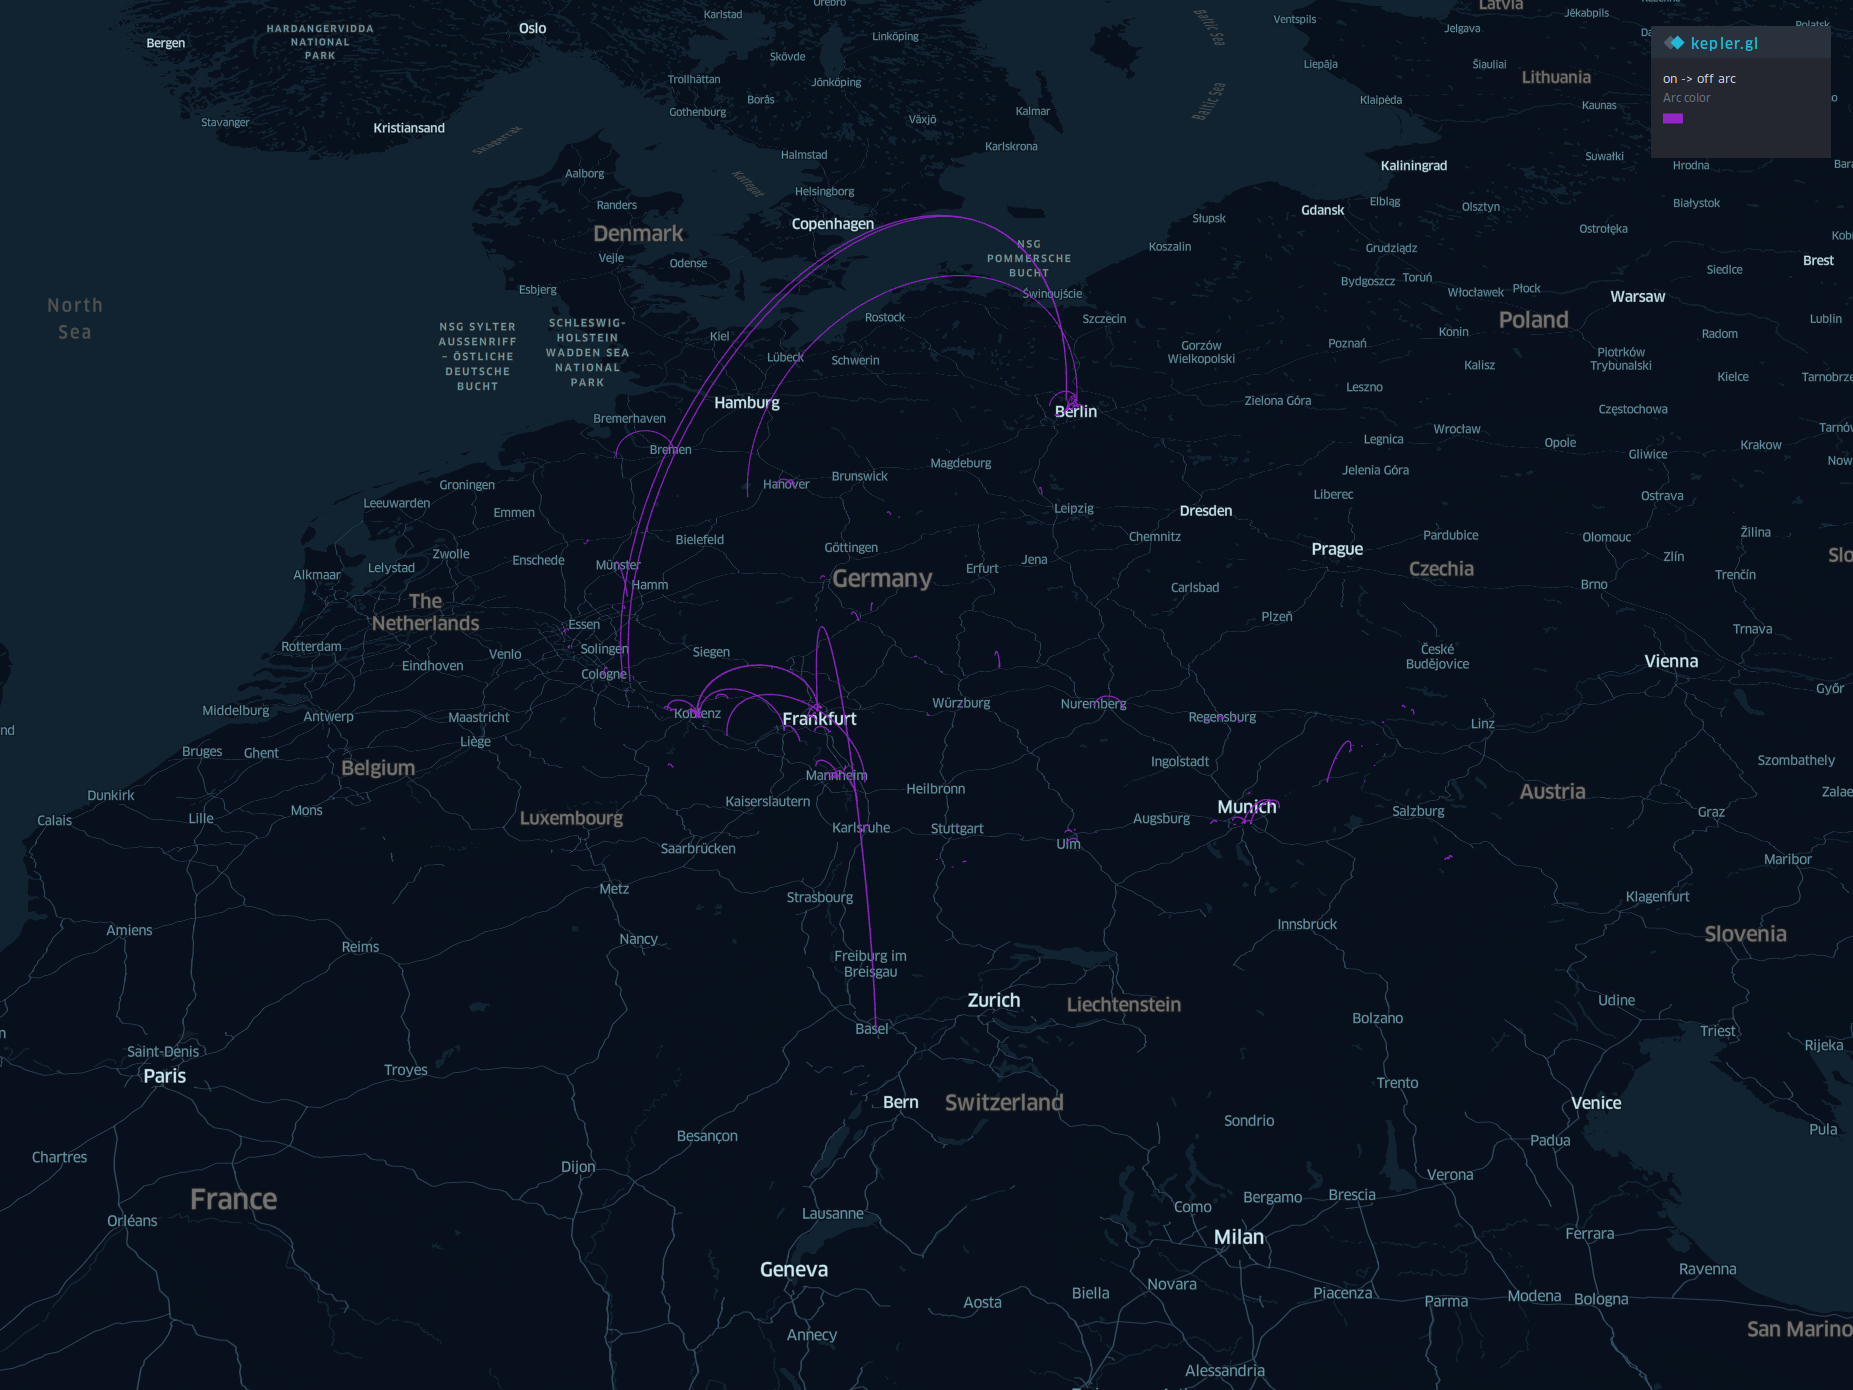
Visualizing my trips from Google Maps with Kepler.gl
In this blog post I will post a visualization of my trips between 2015 and 2018 mainly in germany. Further it contains the Java code that I used to convert […]
-
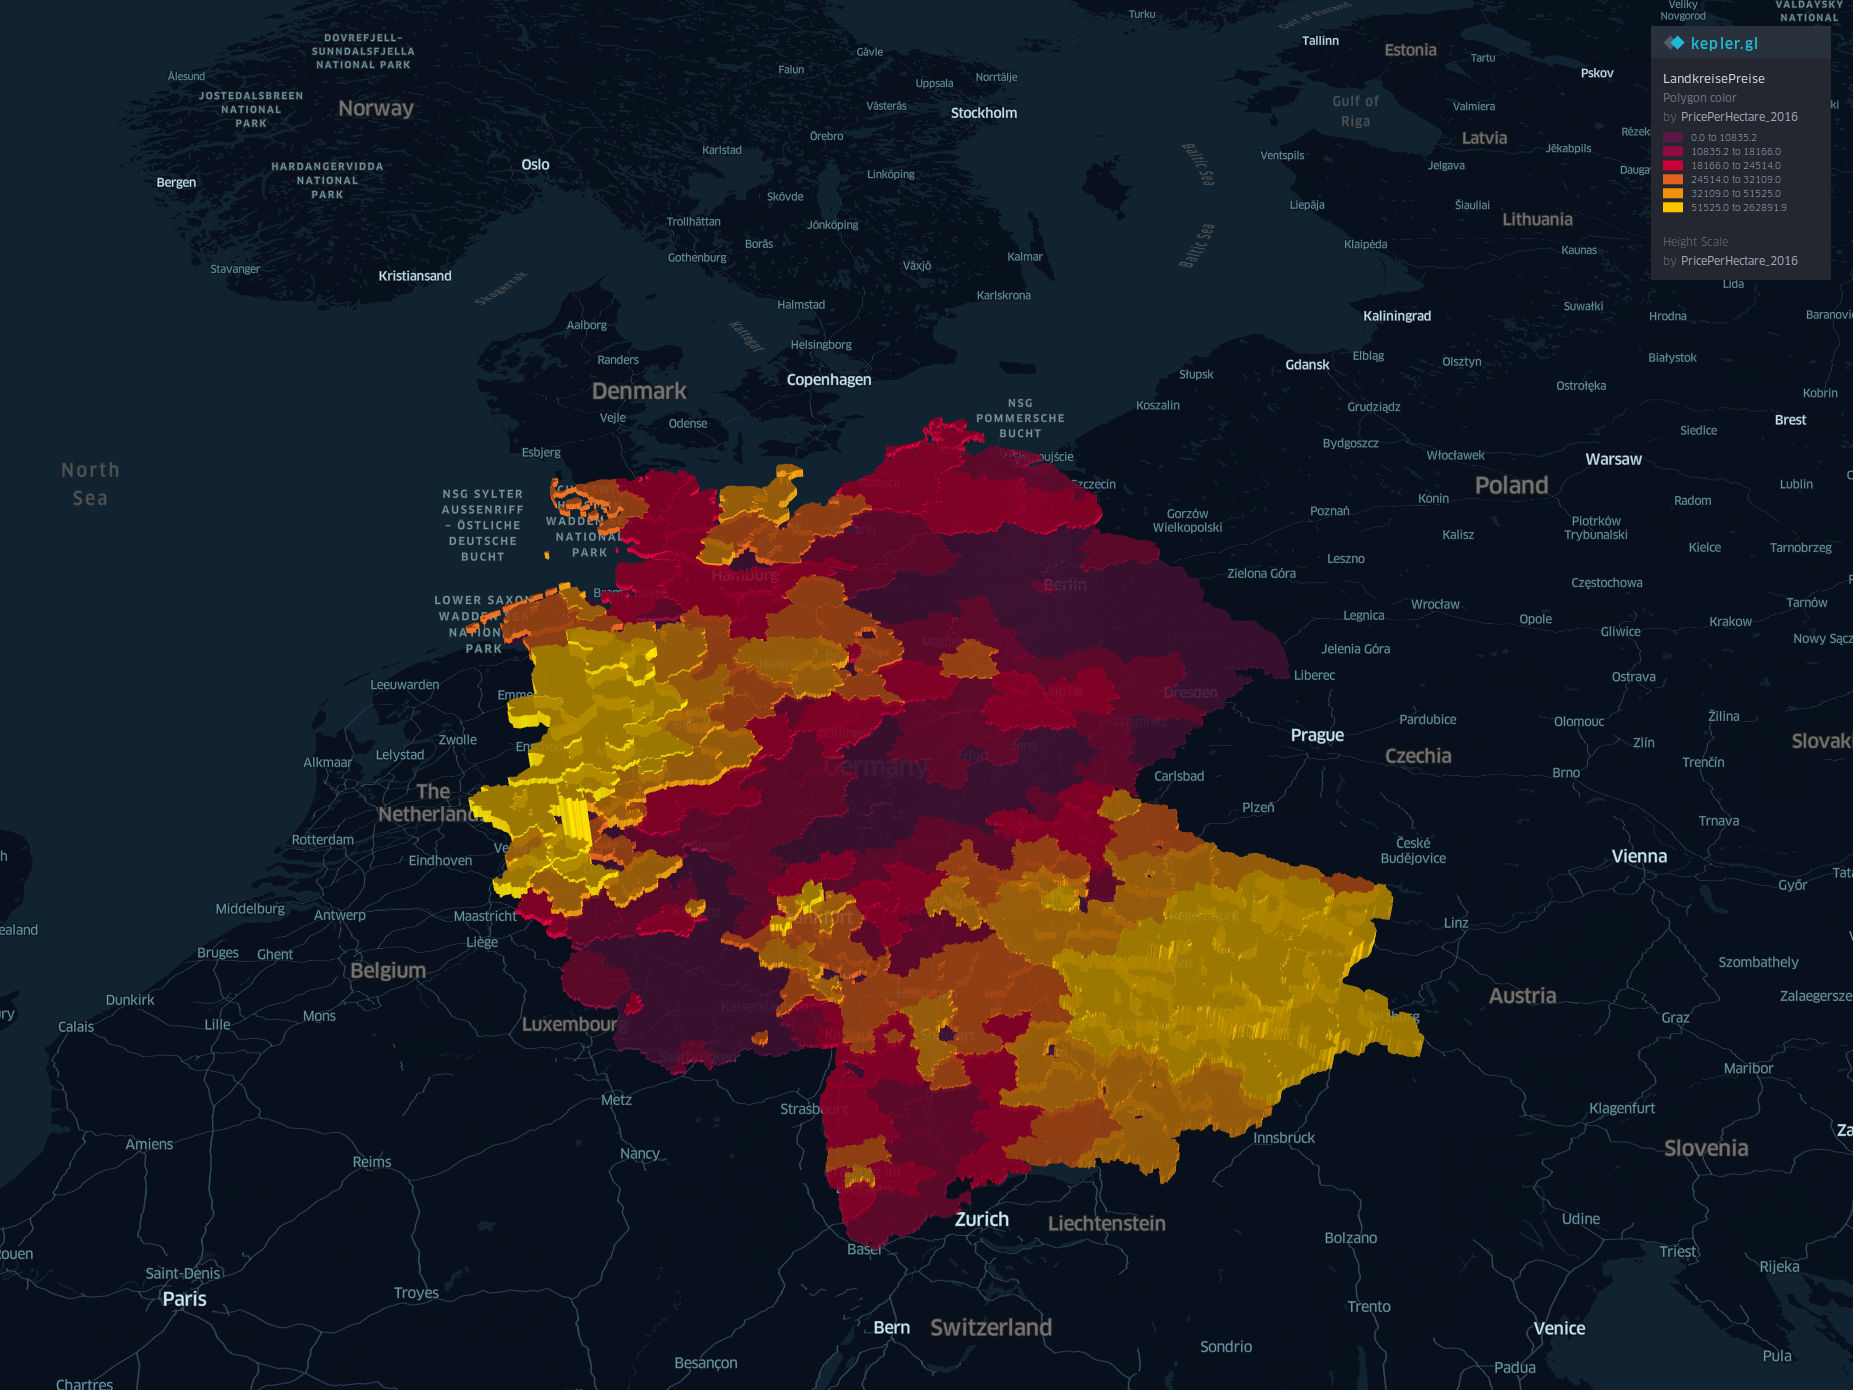
Visualizing farmland property prices in germany based on 2016 sales with kepler.gl
In this blog post I will tell a small data story about farmland prices based on data of 2016. The data is mainly given by Statisches Bundesamt and Bundesanstalt für […]