According to the CHAOS-Report around 70% of IT projects are challenged or completely failing. In the last 10 years these number did not change a lot. It is still the case that around 70% of IT projects fail. This blog post will show you some techniques to control your project and make sure that it is completed in time and in budget.
![]() Inna Pommeranz / pixelio.de
Inna Pommeranz / pixelio.de
Task
For simplification we will assume that a project is a set of tasks that are worked on. They are done or they are not done. The project is done when all tasks are done. The first important thing is that task are countable e.g. an ecommerce project normally contains between 150 and 500 tasks.
Regression or how to predict finish dates
So based on our simplified assumptions we are going to count the finished tasks every week. We will get a table like this:
| Week | Tasks | Cumulated | Todo |
|---|---|---|---|
| 1 | 9 | 9 | 391 |
| 2 | 11 | 20 | 380 |
| 3 | 11 | 31 | 369 |
| 4 | 7 | 38 | 362 |
| 5 | 6 | 44 | 356 |
| 6 | 3 | 47 | 353 |
| 7 | 14 | 61 | 339 |
| 8 | 11 | 72 | 328 |
| 9 | 13 | 85 | 315 |
| 10 | 13 | 98 | 302 |
You can use these numbers to create a regression to predict a finish dates. This kind of chart is often called burn down chart:
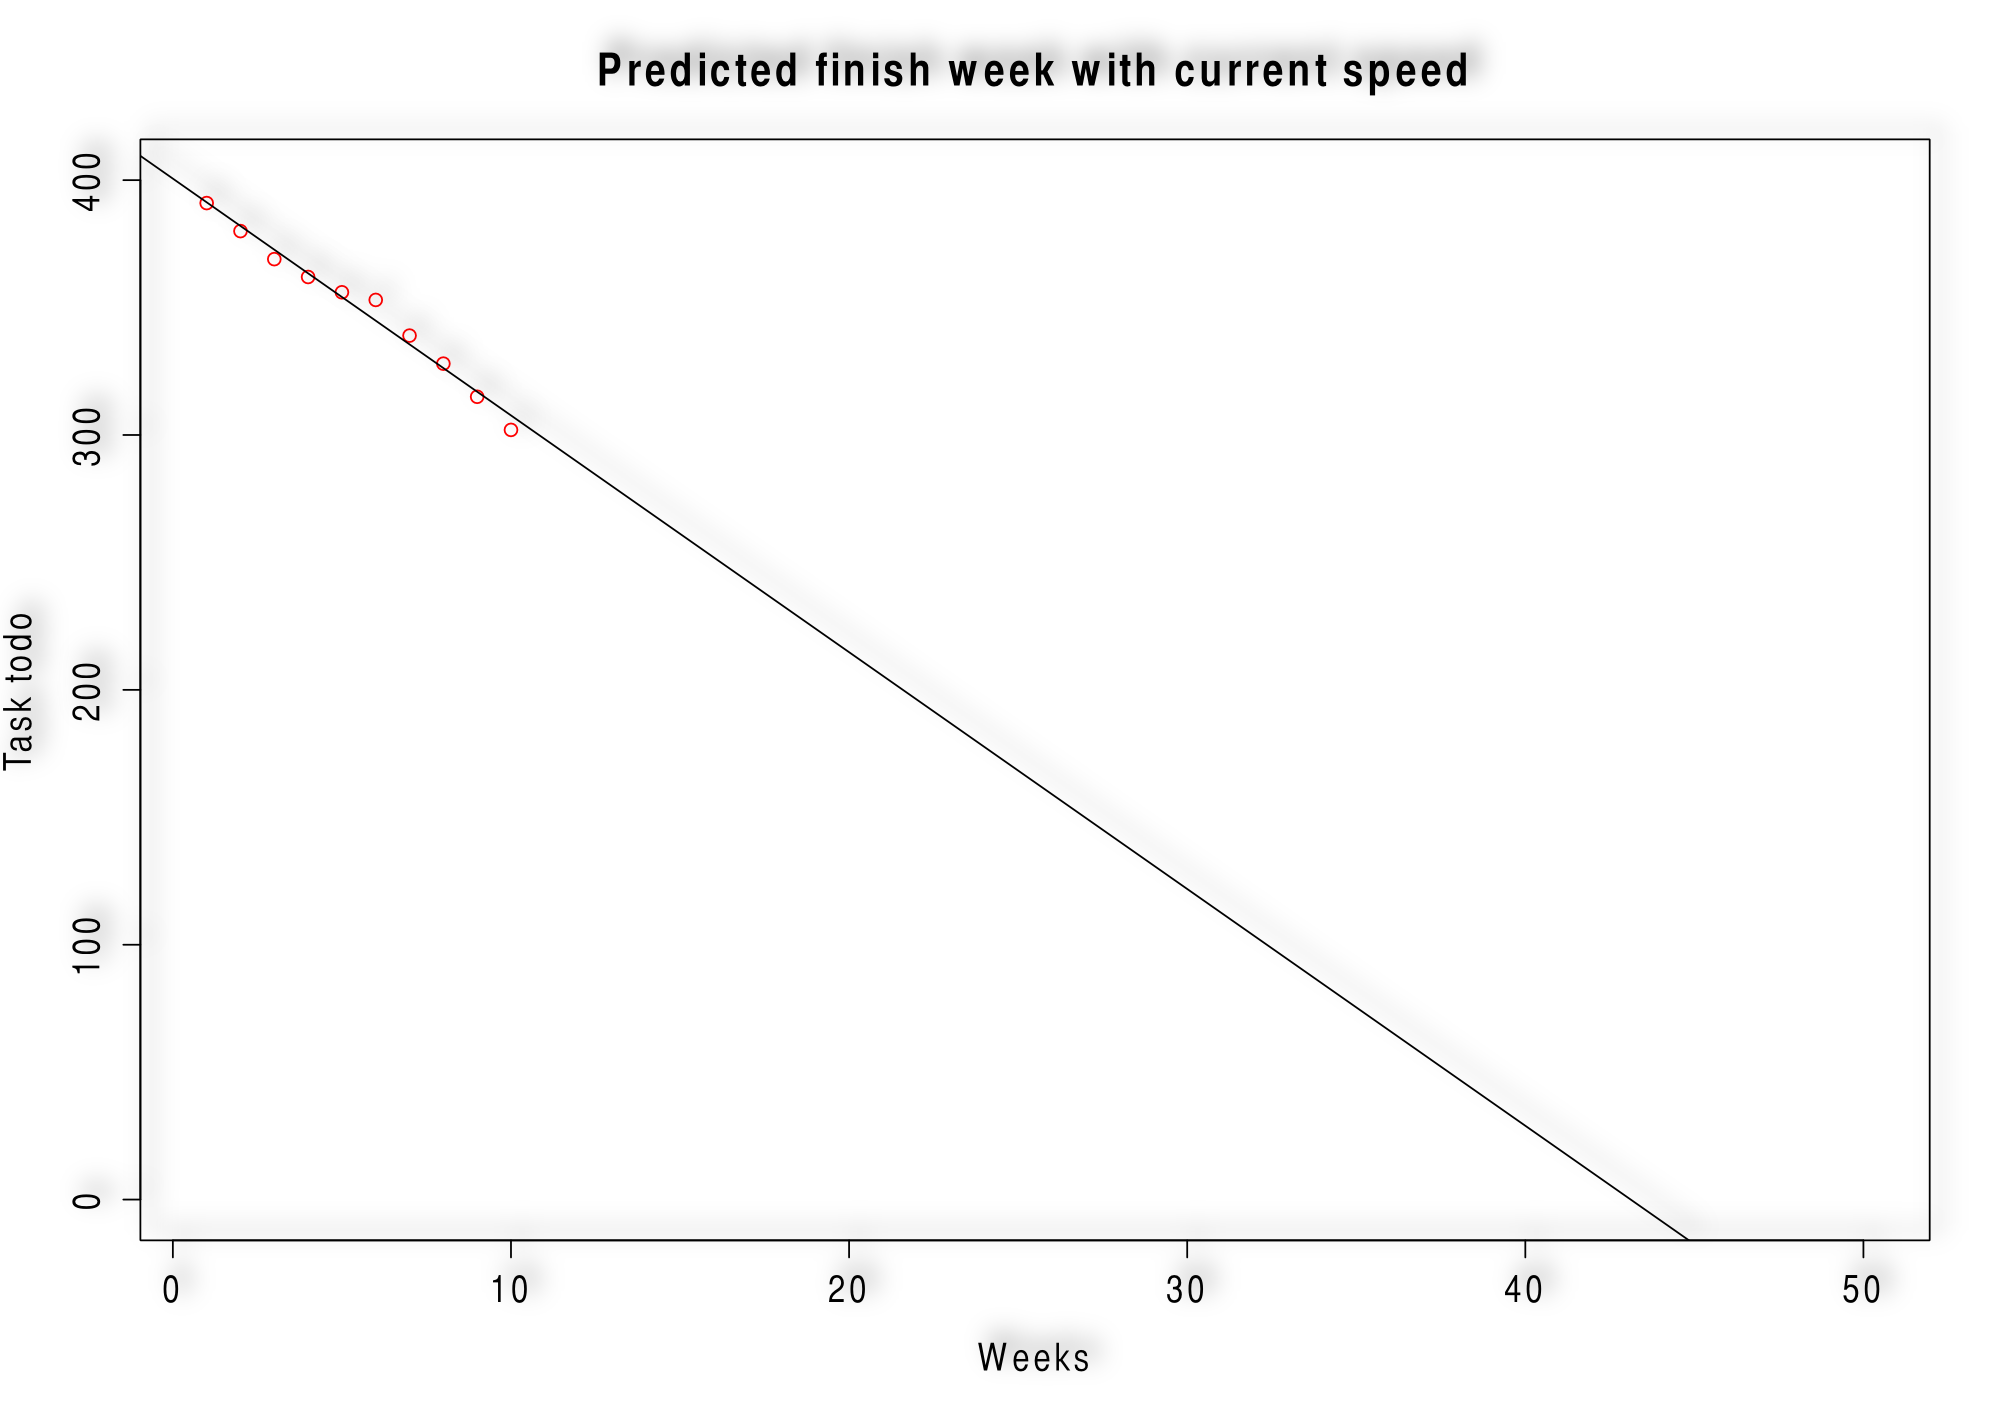
To create the chart above use the following R code:
# Open tasks per week
finishedTask <- c(391, 380, 369, 362, 356, 353, 339, 328, 315, 302)
# extend the finished task to 50 weeks
finishedTask[50] <- NA
# create a sequence representing weeks
week <- seq(1:50)
# Fit a linear model to the finished tasks
regression <- lm(finishedTask ~ week)
# Generate graph
plot(week, finishedTask, ylim=c(0, 400), main=paste("Predicted finish week with current speed"), ylab="Task todo", xlab="Weeks", col=c("red"))
# Add regression line
abline(regression)
Change requests
A project manager should keep the requirements stable. Nevertheless there are always change requests. In average the project requirements are changing around 10% every month. A good tip is already to reject most of the change requests and not making projects longer then 6 month. Nevertheless lets assume we allow some change requests and now we want to give a reliable answer how long it will take to integrate the change request. The request is a task as well. So we want to know with 95% probability when the task will be done latest.
We have to measure how long the current task took e.g.:
| Task | Time in hours |
|---|---|
| 1 | 1 |
| 2 | 6 |
| 3 | 19 |
| 4 | 9 |
| 5 | 9 |
| 6 | 10 |
| 7 | 18 |
| 8 | 4 |
| 9 | 12 |
| 10 | 35 |
| 11 | 3 |
| 12 | 21 |
| 13 | 2 |
| 14 | 7 |
| 15 | 6 |
| 16 | 28 |
| 17 | 1 |
| 18 | 3 |
| 19 | 2 |
| 20 | 3 |
| 21 | 1 |
| 22 | 12 |
| 23 | 10 |
| 24 | 25 |
| 25 | 16 |
| 26 | 5 |
| 27 | 6 |
| 28 | 5 |
| 29 | 46 |
| 30 | 17 |
| 31 | 6 |
| 32 | 16 |
| 33 | 6 |
| 34 | 10 |
| 35 | 9 |
| 36 | 10 |
| 37 | 12 |
| 38 | 2 |
| 39 | 3 |
| 40 | 98 |
| 41 | 14 |
| 42 | 10 |
| 43 | 8 |
| 44 | 14 |
| 45 | 14 |
| 46 | 8 |
| 47 | 4 |
| 48 | 3 |
| 49 | 4 |
| 50 | 8 |
| 51 | 17 |
| 52 | 3 |
| 53 | 8 |
| 54 | 10 |
| 55 | 2 |
| 56 | 4 |
| 57 | 8 |
| 58 | 6 |
| 59 | 15 |
| 60 | 2 |
| 61 | 5 |
| 62 | 8 |
| 63 | 10 |
| 64 | 11 |
| 65 | 18 |
| 66 | 5 |
| 67 | 2 |
| 68 | 19 |
| 69 | 9 |
| 70 | 42 |
| 71 | 2 |
| 72 | 11 |
| 73 | 22 |
| 74 | 6 |
| 75 | 32 |
| 76 | 25 |
| 77 | 1 |
| 78 | 1 |
| 79 | 0 |
| 80 | 18 |
| 81 | 5 |
| 82 | 6 |
| 83 | 3 |
| 84 | 1 |
| 85 | 3 |
| 86 | 7 |
| 87 | 4 |
| 88 | 54 |
| 89 | 7 |
| 90 | 7 |
| 91 | 5 |
| 92 | 3 |
| 93 | 52 |
| 94 | 21 |
| 95 | 6 |
| 96 | 5 |
| 97 | 1 |
| 98 | 16 |
Based on this data we can now create a histogram how long it takes to finish a certain task:

Maybe you recognized the completion times are log normal distributed. We can use this knowledge to fit a log normal distribution.
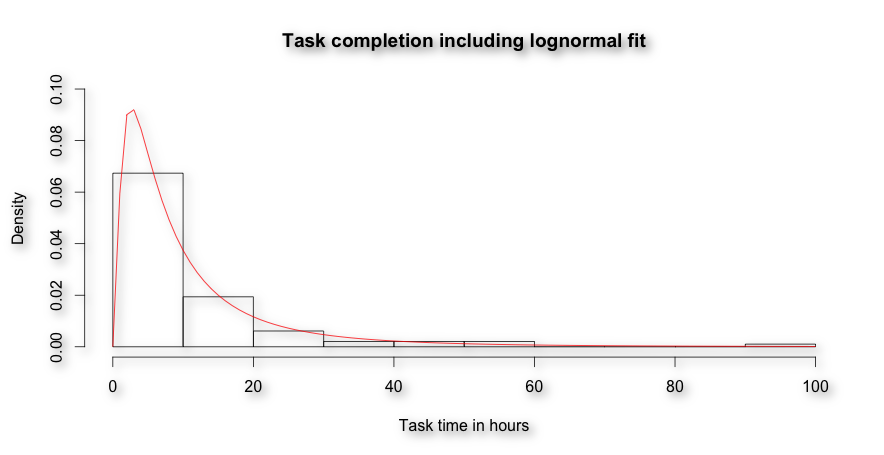
Based on this fit (meanlog=1.95625255, sdlog=1.00433813) we can predict with a probability of 95% that we will finish the change request in 36 hours (qlnorm(0.95, 1.95625255, 1.00433813) = 36.90111).
If you want to use such sophisticated statistics in your company please do not hesitate to contact us.
Leave a Reply