
This blog post will contain a description of the routing algorithm that was implemented on the 23.11. – 25.11.2018 on the debeka hackquarter to find safer cycling routes in Koblenz. It uses Java EE (wildfly), PostgreSQL and pgRouting for the backend. The frontend was implemented using mapbox JS GL. The source can be found on github. The whole coding took around 8 hours for 2 persons. During the presentation the following summary was visualized:

Demonstration
The video above shows an exampl of a calculated route with a german explanation.
Accident data
The data that was used for this approach was given by the Statistisches Landesamt Rheinland-Pfalz. It is now available on the Unfallatlas.
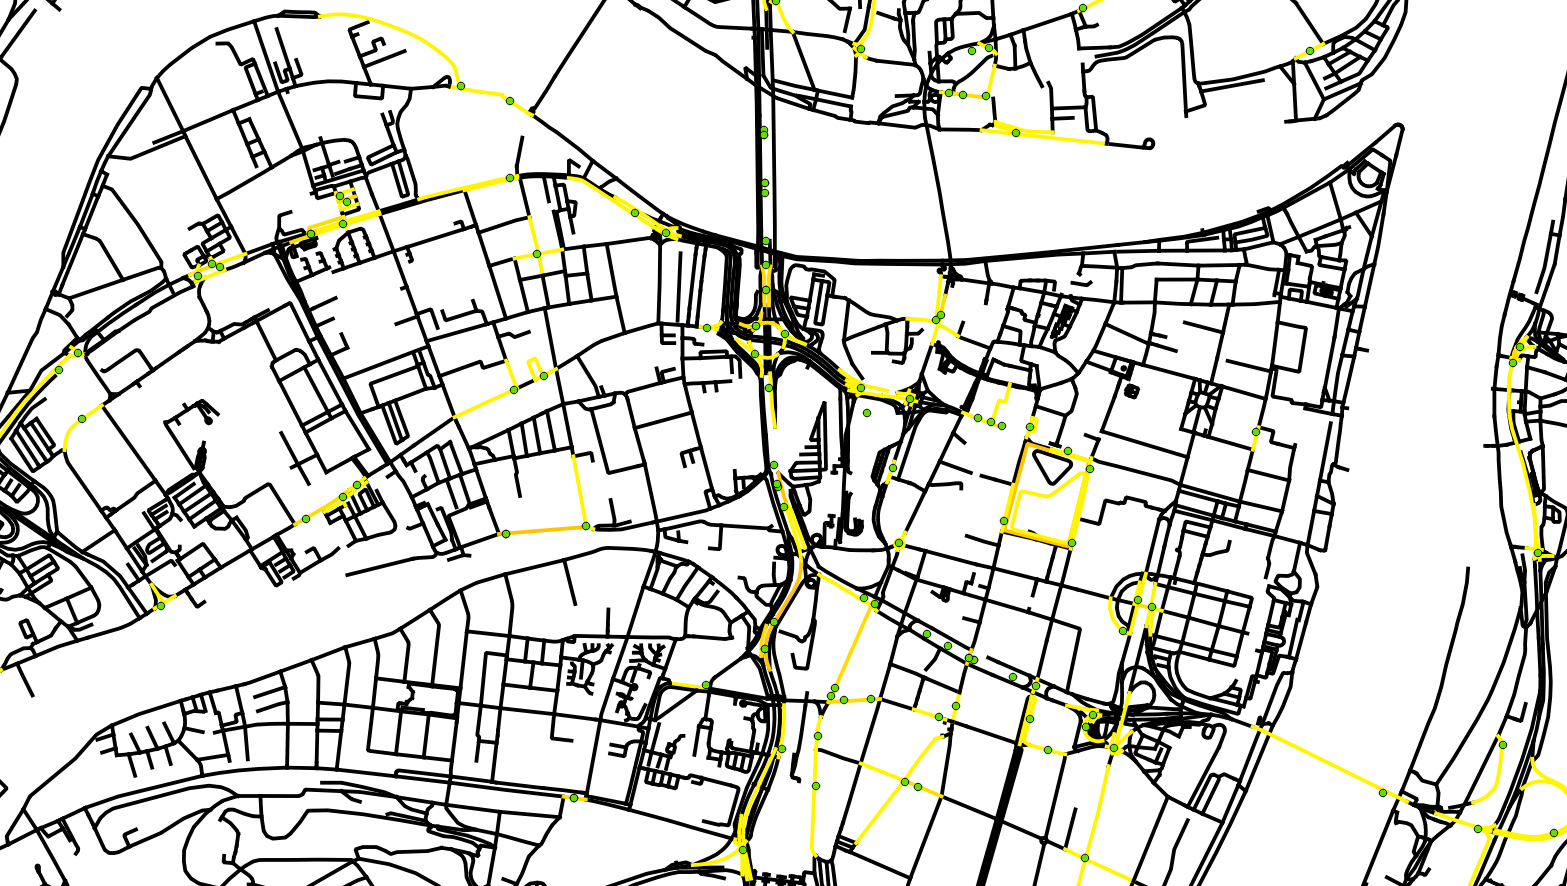
In the image above you can see the dots, that represent accidents in 2017, and the color of the streets that represent the amount of accidents that happend on the street. For matching accidents to streets a buffer around the street was created, afterwards a spatial join between ways and accidents was done and in the end the result was aggregated by way. The sql statements that were used to macht them can be found in the git repository.
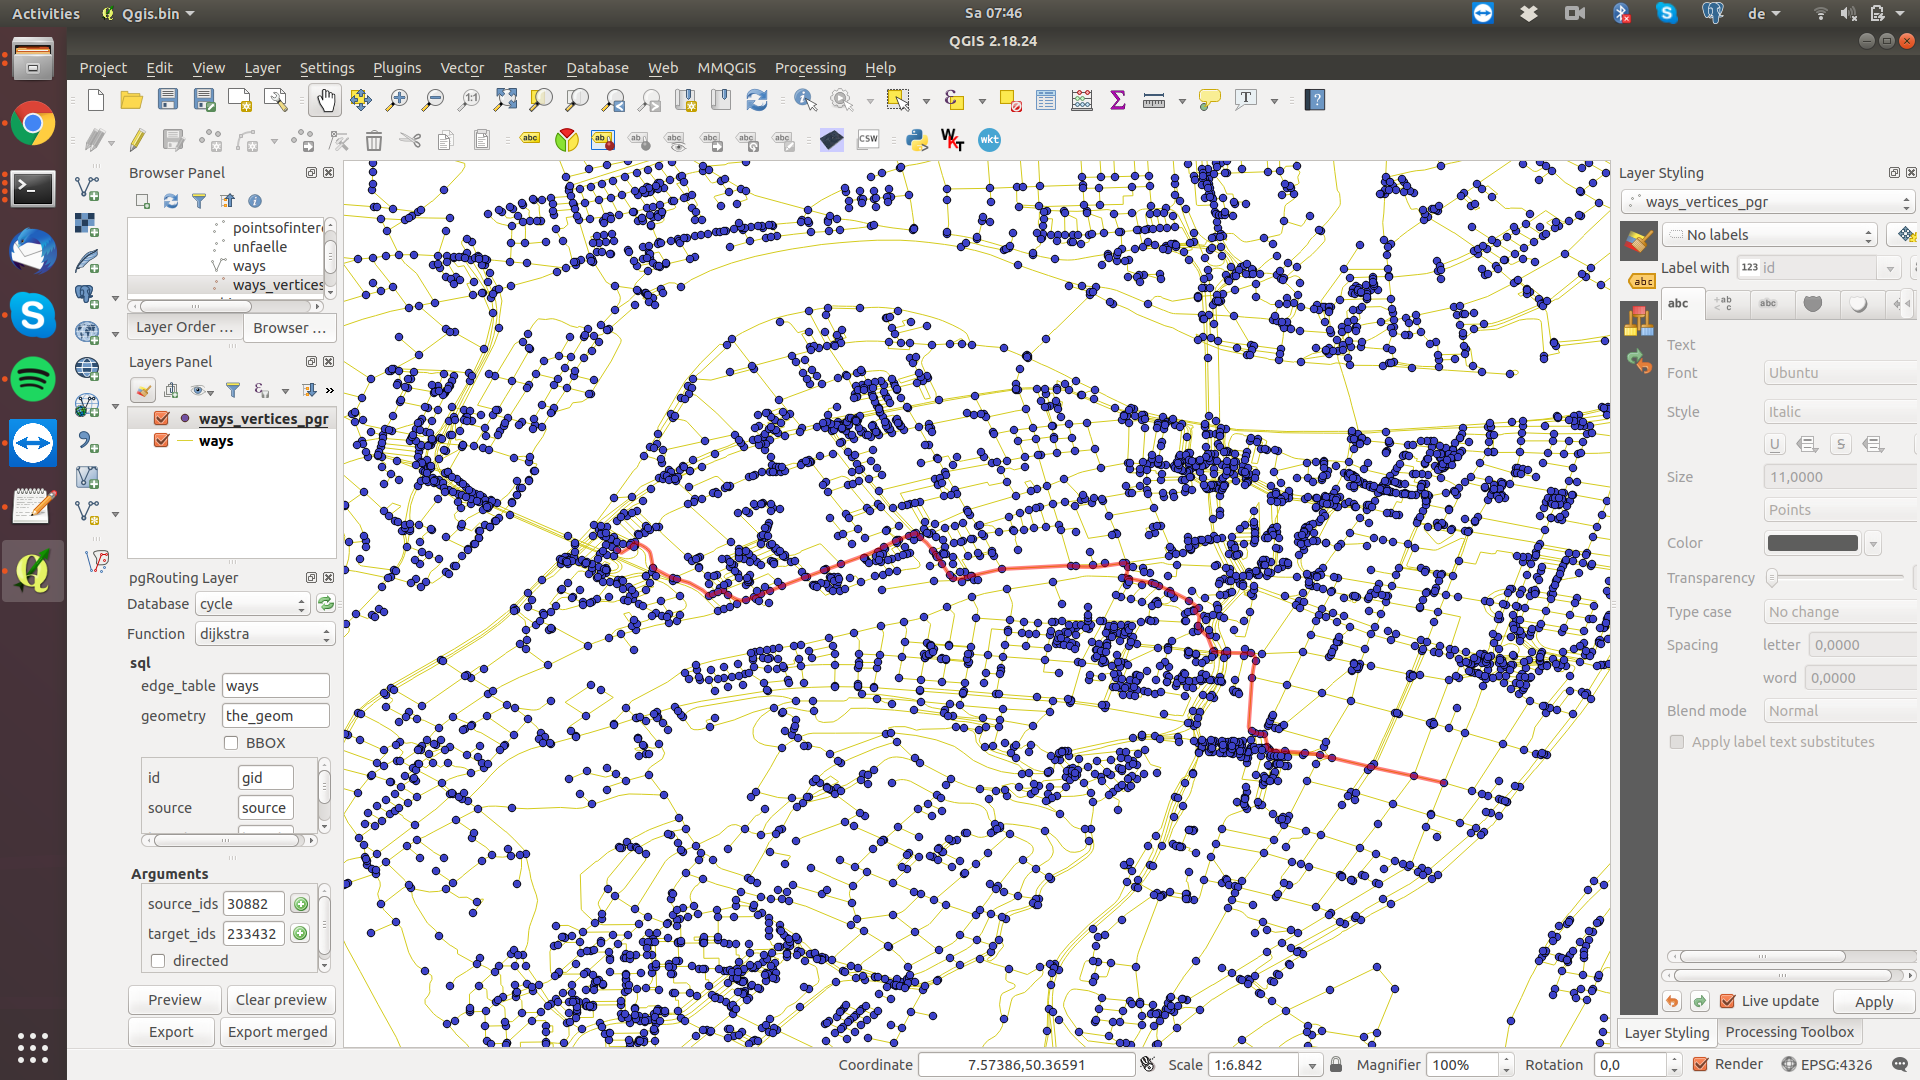
Here is another screenshot showing the data in QGis already including a route using the plugin pgRoutingLayer:
Architecture
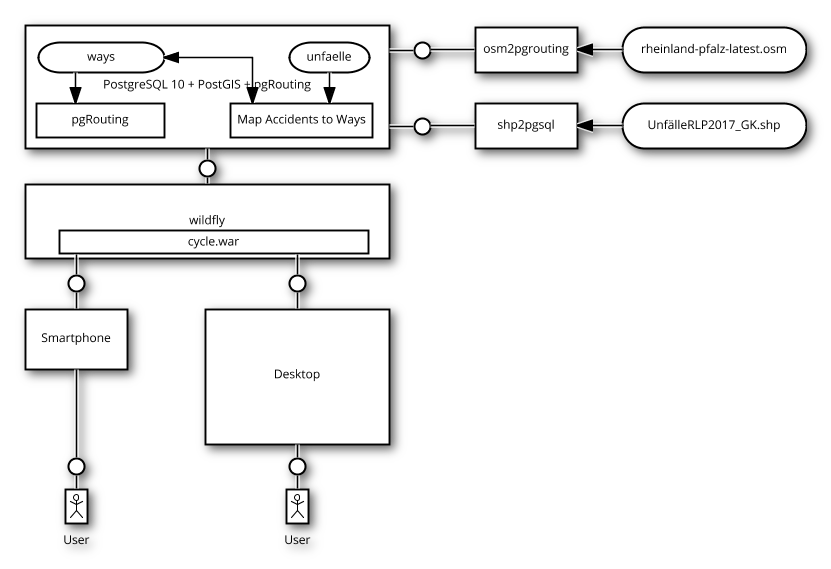
The image above shows the general architecture of the solution. The main work is done inside a PostgreSQL database. It imports the data through the tools osm2pgrouting and shp2pgsql. The path finding is done using the pgRouting extension using the following two queries:
Safe route query:
SELECT
    ST_AsGeoJSON(w.the_geom)
FROM pgr_dijkstra('
    SELECT gid AS id,
        source AS source,
        target AS target,
        cost * (accidents+1) AS cost
    FROM ways',
array[:startId]\:\:BIGINT[], array[:endId]\:\:BIGINT[], false) as pgr, ways w WHERE pgr.edge = w.gid
Normal route query:
SELECT
    ST_AsGeoJSON(w.the_geom)
FROM pgr_dijkstra('
    SELECT gid AS id,
        source AS source,
        target AS target,
        cost AS cost
    FROM ways',
array[:startId]\:\:BIGINT[], array[:endId]\:\:BIGINT[], false) as pgr, ways w WHERE pgr.edge = w.gid
As you can see the “cost” is just modelled as the costs multiplied by the amount of accidents of the route.
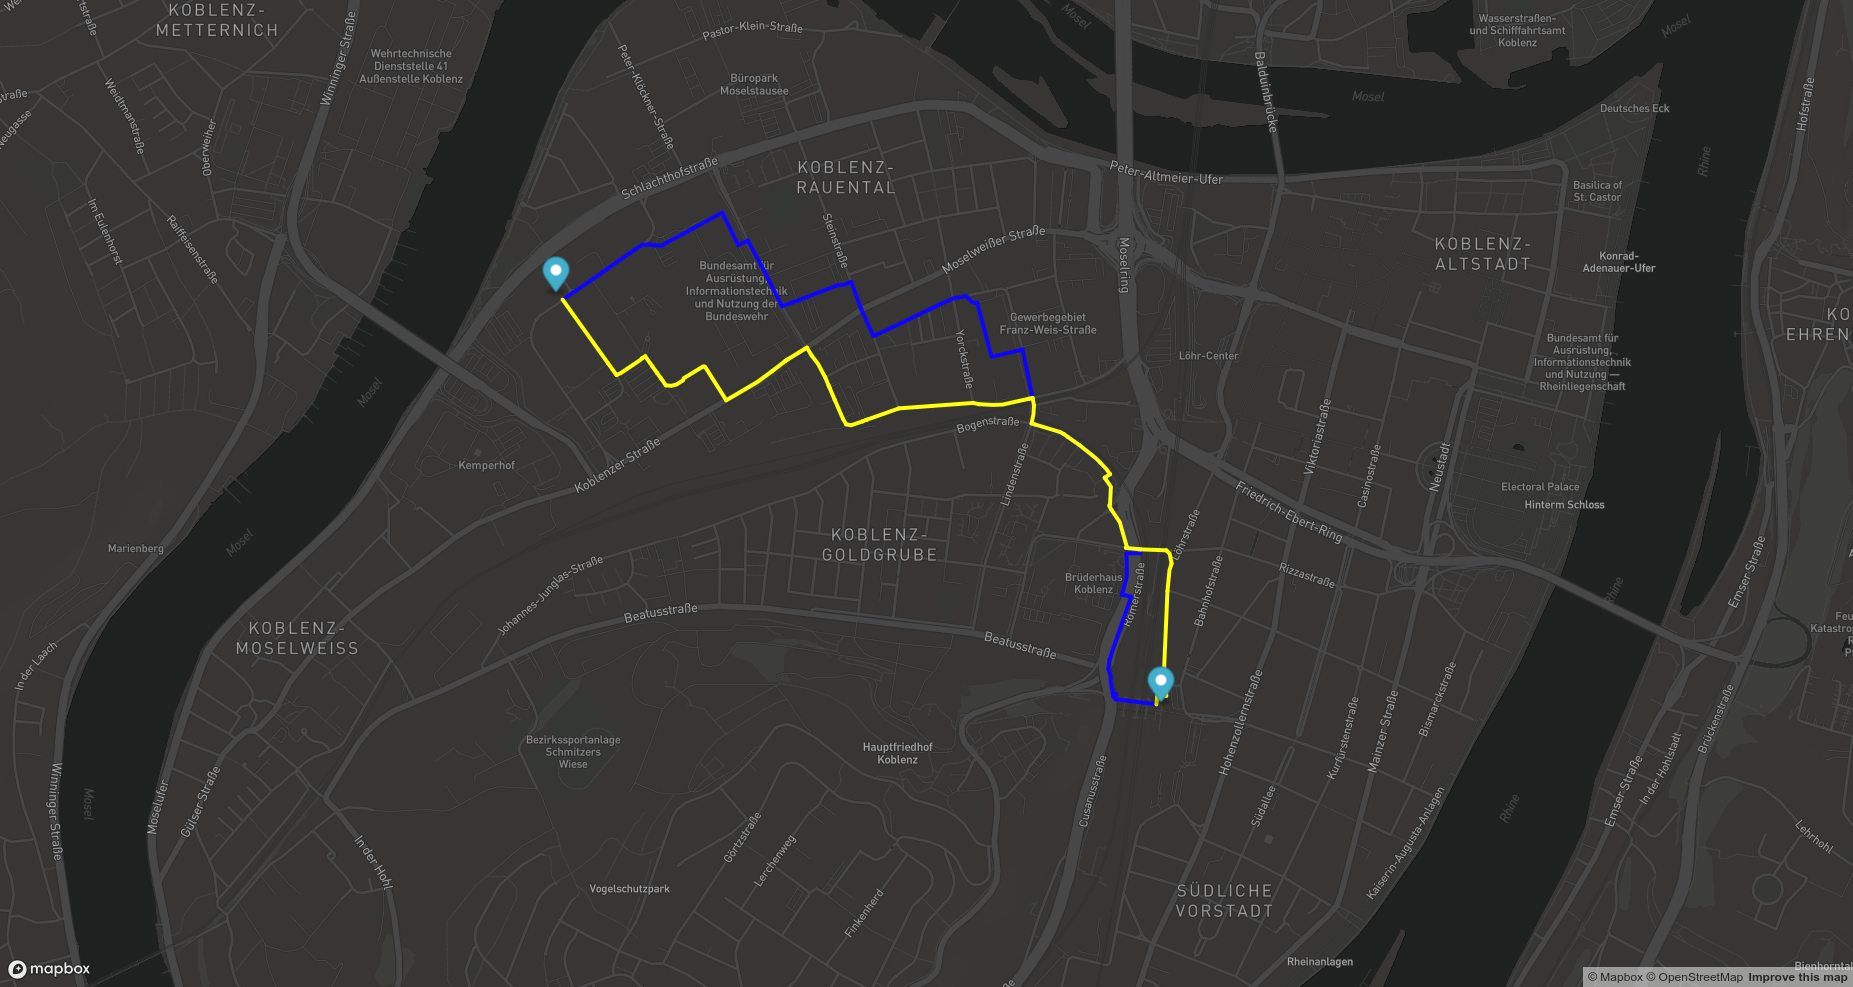
Example routes in the frontend
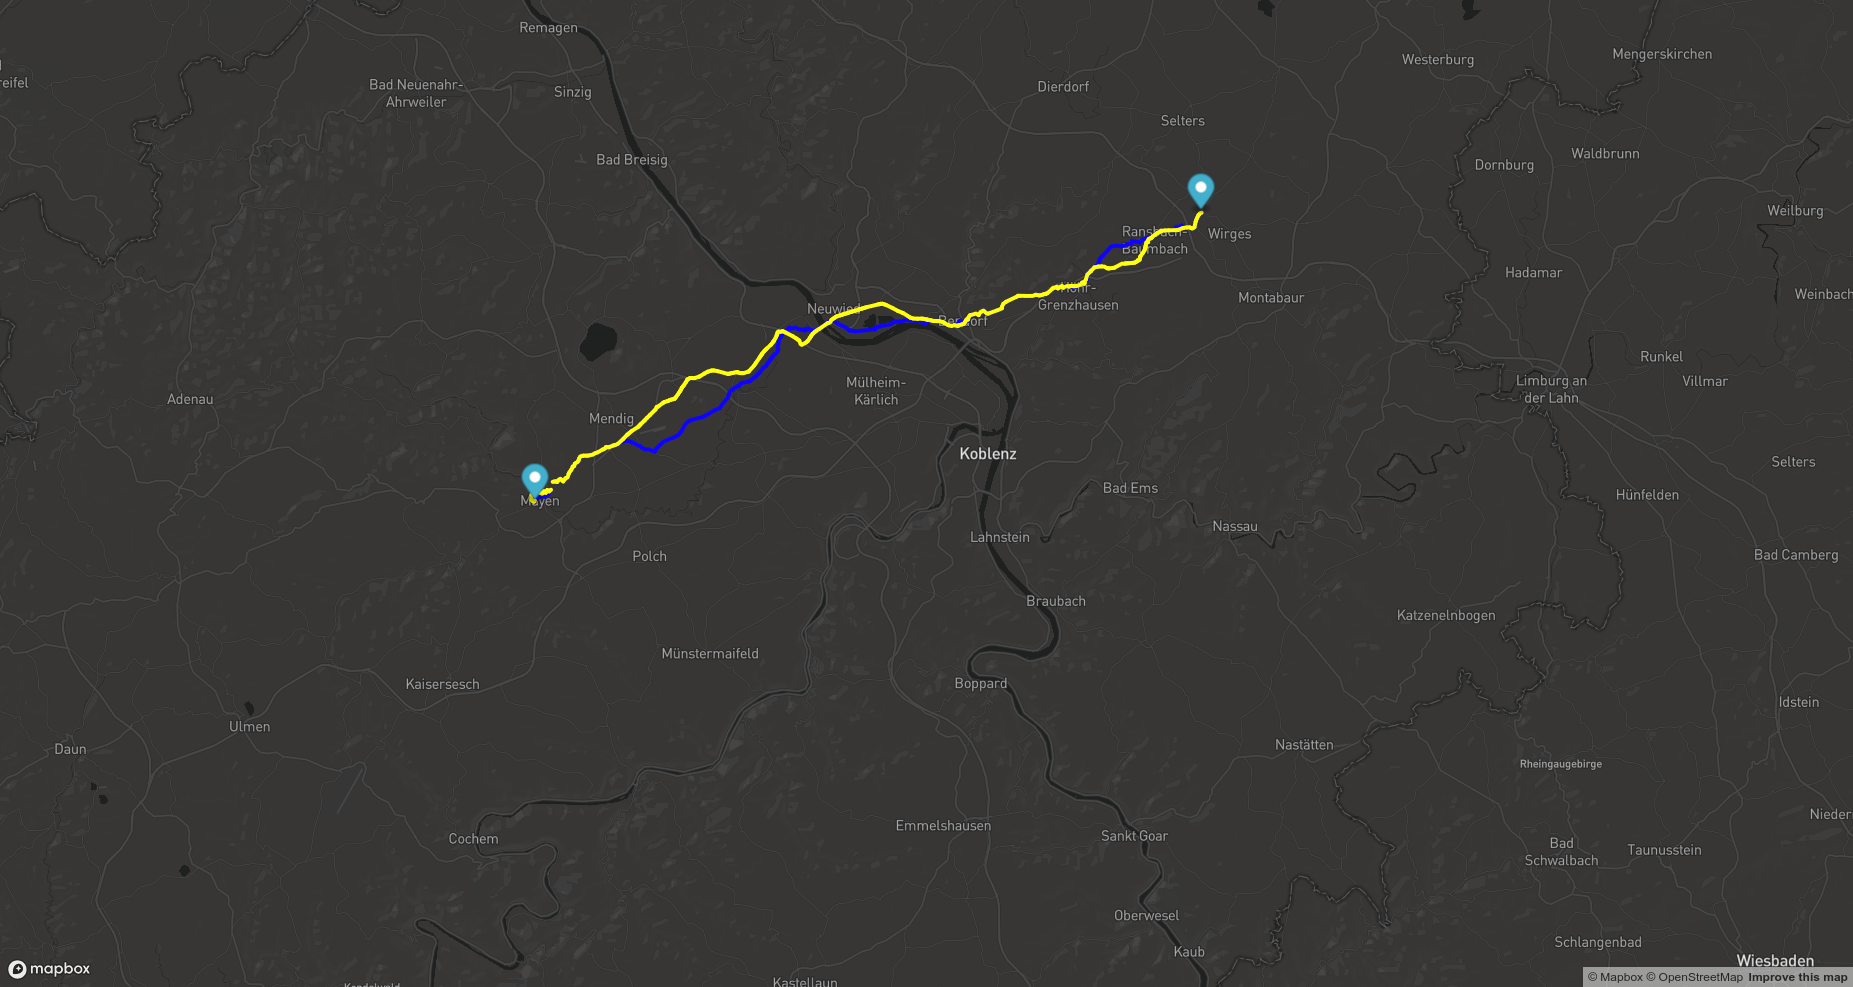
The frontend was implemented using mapbox. It just loads the routes as a colored GeoJSON layer. This produced e.g. the following results:
Example 1
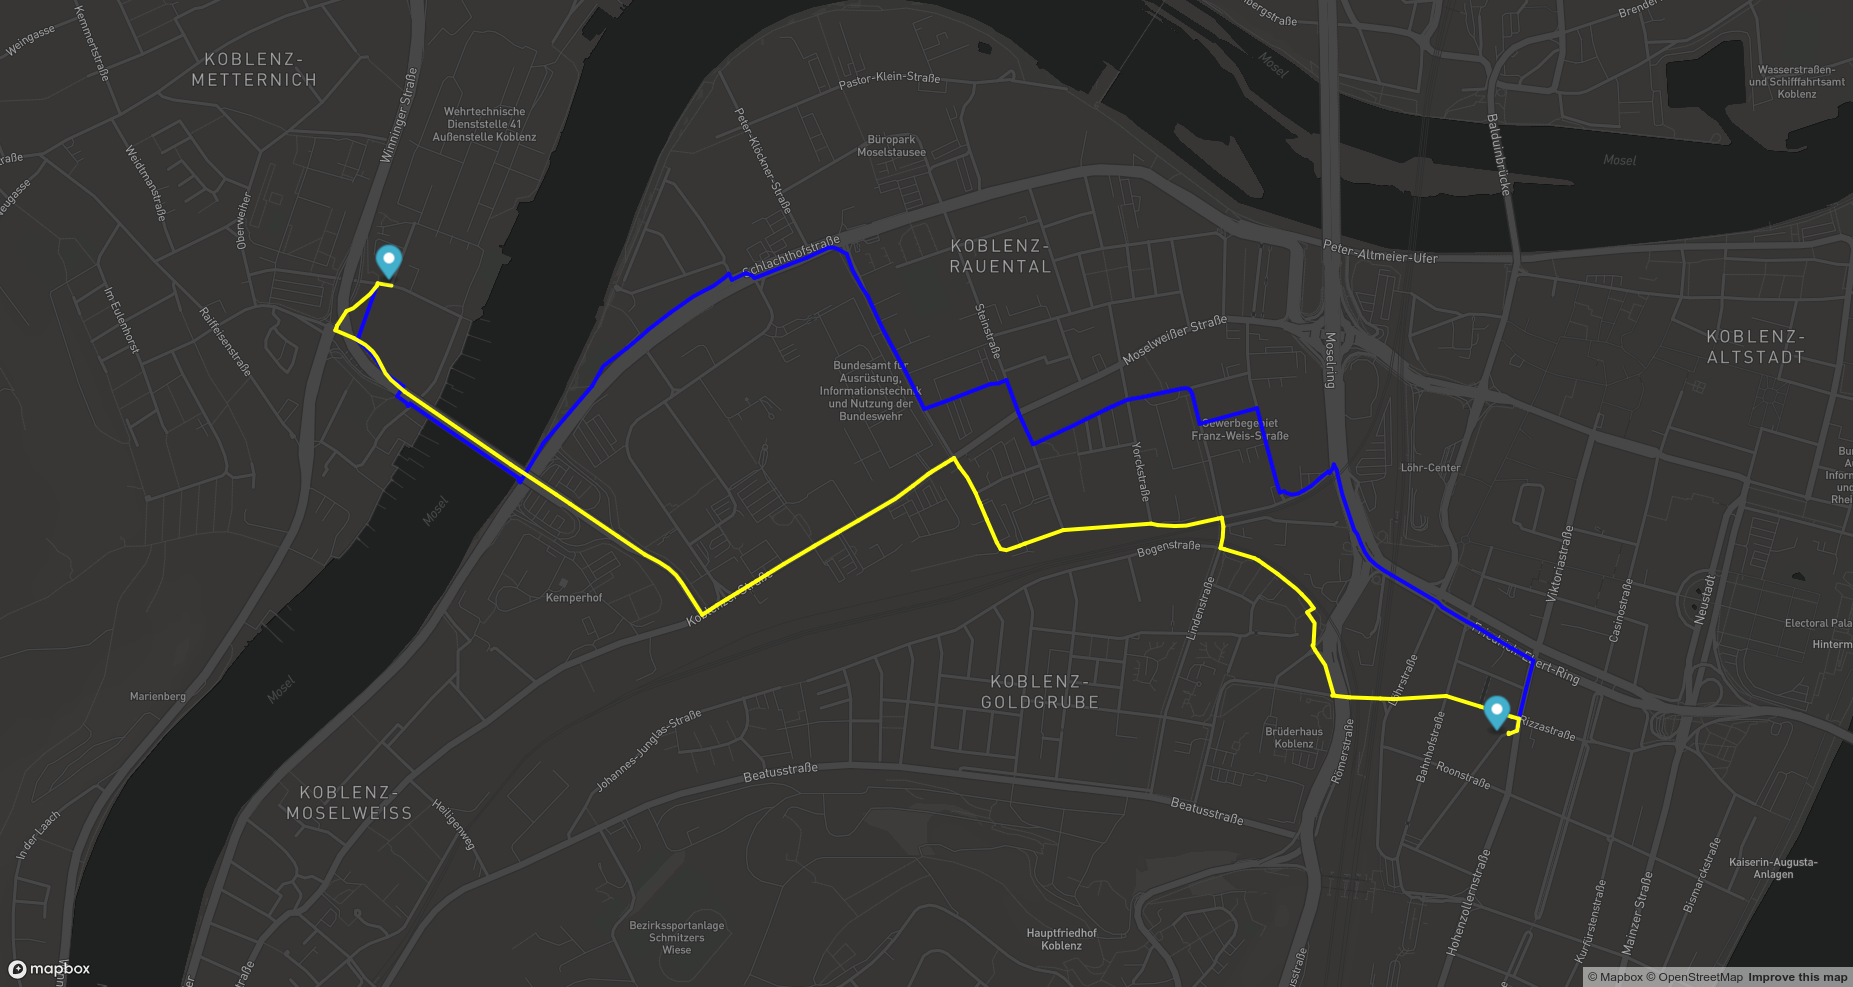
Example 2
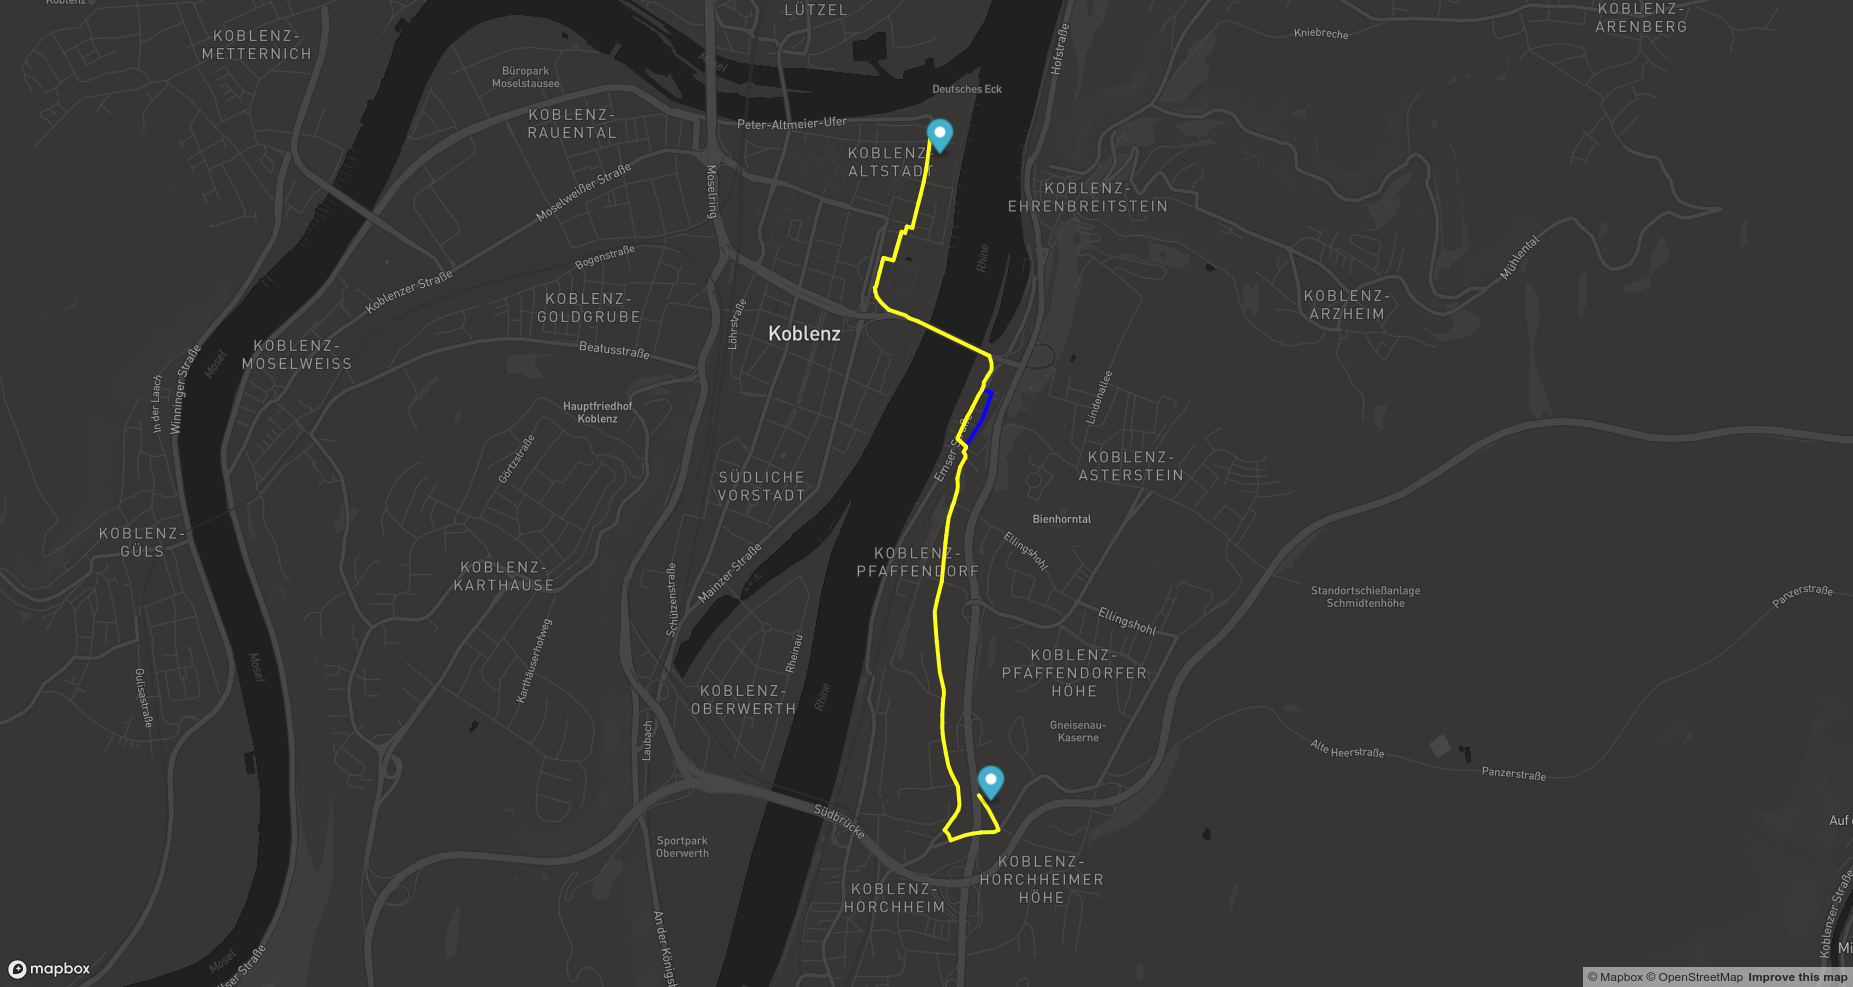
Example 3
Example 4
We were also mentioned in the newspaper:

Conclusion
In the end we were 4th place. I think that the idea was beyond the typical business model of an insurance and therefore others (retirment analysis, customer communication and claim reporting) were higher ranked than our idea. From a technical point of view it was amazing what was possible within 2 days if you know what you want to achieve and if you reuse already available technology.
If you need a similair solution feel free to conctact us.
Leave a Reply