In this blog post we will show an example of the methods that the incentergy platform applies to do mathematically proven optimal decisions for online marketing budget allocations. The system must make some assumptions about how the revenue which was generated by the marketing channel. Under these assumptions the shown behavior is optimal. This means that there is no way to spend less money to win this explore-exploit-dilemma.
Also read: Optimal Marketing Budget Allocation with Non Linear Solving
Example: which channel will pay the highest reward
Consider the following example. You are an online merchant and you are doing monthly marketing budget allocation. You want to spend $10.000 in $1.000 dollar chunks on the following channels:
- Banners
- Social Media
- Affiliate Marketing
- AdWords
- Email Marketing
So you do not know yet which channel will yield the highest reward. So for you it makes sense to just distribute your budget evenly to explore which channel is the best. In the first month you are doing the following allocation:
- Banners ($2.000)
- Social Media ($2.000)
- Affiliate Marketing ($2.000)
- AdWords ($2.000)
- Email Marketing ($2.000)
You get the following revenue from the channels:
- Banners -> $1,895.10 (-5% relative loss)
- Social Media -> $2,640.20 (32% relative profit)
- Affiliate Marketing -> $814 (-59% relative loss)
- AdWords -> $2,972.06 (49% relative profit)
- Email Marketing -> $2,429.10 (21% relative profit)
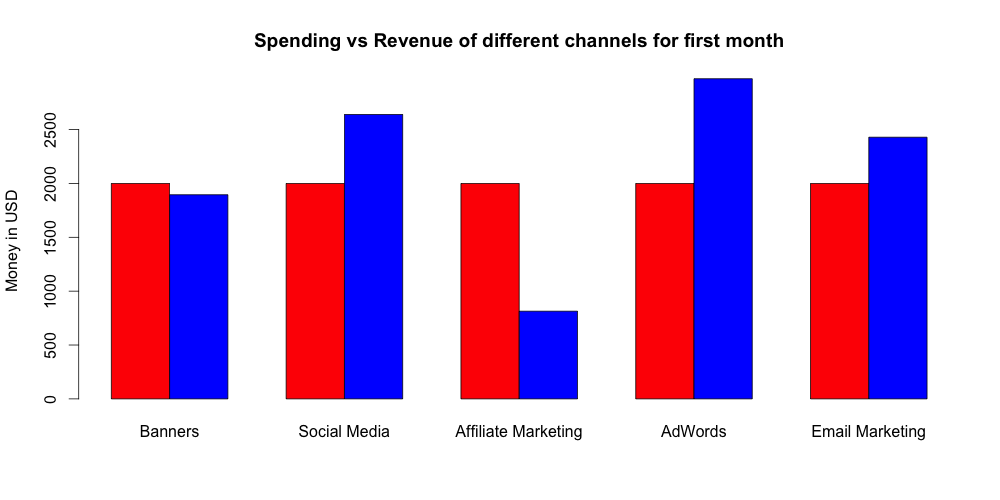
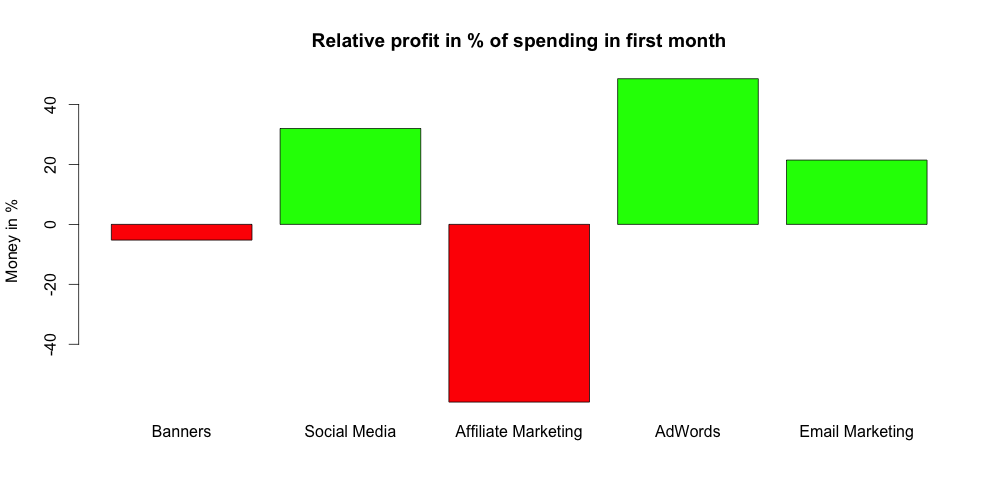
As you can see AdWords was the strongest performing campaign you spend $2,000 and you had $2,429.10 revenue. Meaning this campaign generated $429 more then it cost.
Now for the second month knowing that AdWords is a strong performing marketing channel you are going to spend 60% of your marketing budget for the strongest channel and the rest evenly distributed on all other channels.
- Banners ($1.000)
- Social Media ($1.000)
- Affiliate Marketing ($1.000)
- AdWords ($6.000)
- Email Marketing ($1.000)
This month you get the following revenue from the different channels.
- Banners $840.41 (-16% relative loss)
- Social Media $683.93 (-32% relative loss)
- Affiliate Marketing $1,194.59 (19% relative profit)
- AdWords $6,978.49 (16% relative profit)
- Email Marketing $1253.59 (25% relative profit)
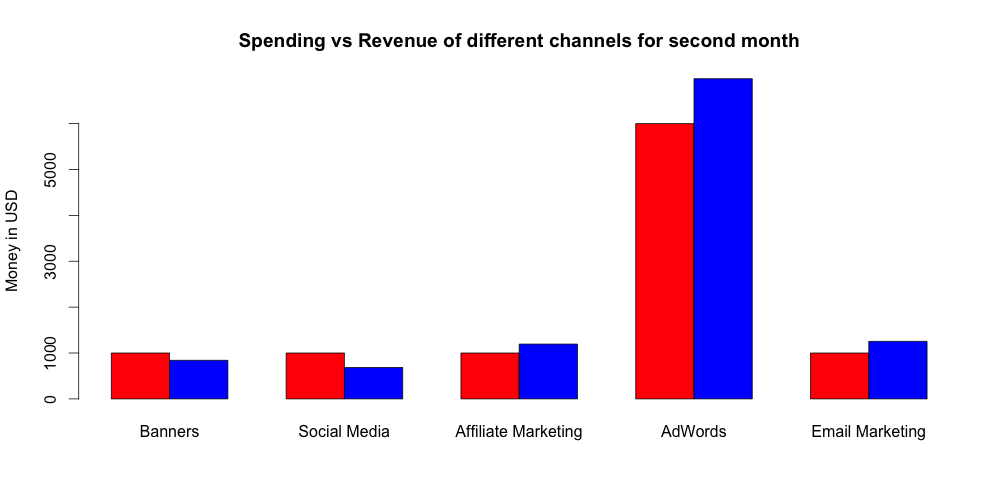
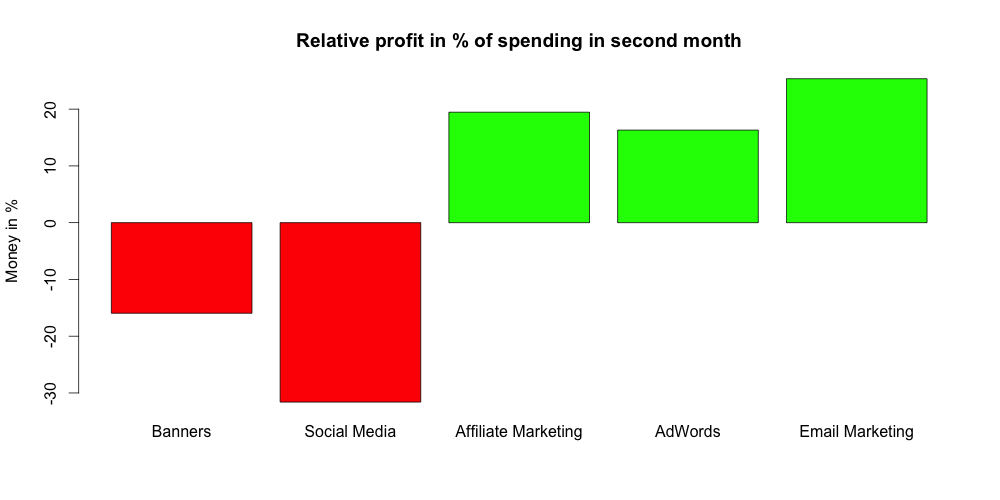
As you can see that in the second month the email marketing campaign was performing stronger then AdWords campaign. Nevertheless the AdWords campaign is still pretty ok. You are continuing your 60% for the best 40% spend evenly on the other strategy for the next 3 years.
Optimal strategy by incentergy
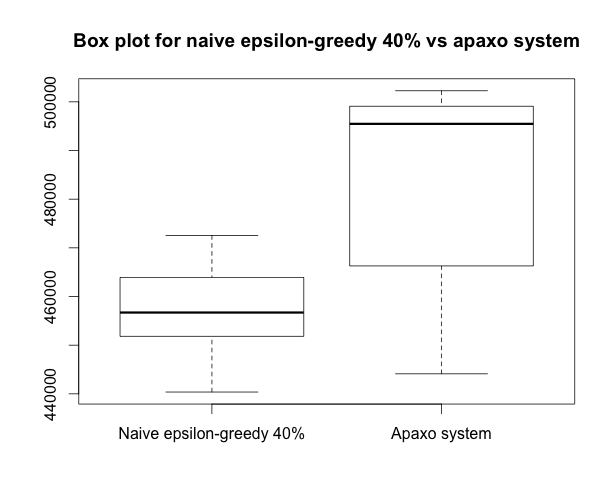
The incentergy system uses sophisticated statistical strategies to perform optimal decisions under conditions of uncertainty. In this particular example incentergy has to solve an explore-exploit problem. We ran the naive strategy against our incentergy strategy for 36 month. We ran this simulation 10 times.
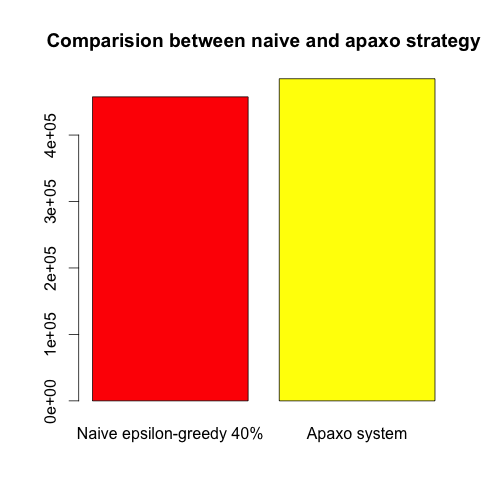
In this example our budget allocation strategy outperforms the naive strategy by $27,277.03 significantly (t = 3.7583, df = 12.256, p-value = 0.002634). The average of the naive strategy was $457,505.80. The optimized strategy in average had $484,782.90. This means a saving of ~6% by using a better allocation strategy.
In the literature the naive strategy is often called ε-greedy. Where in our case it is an ε-greedy 40% strategy.
Probability distributions used for simulation
The next image shows which probability distributions were assumed for the different channels.
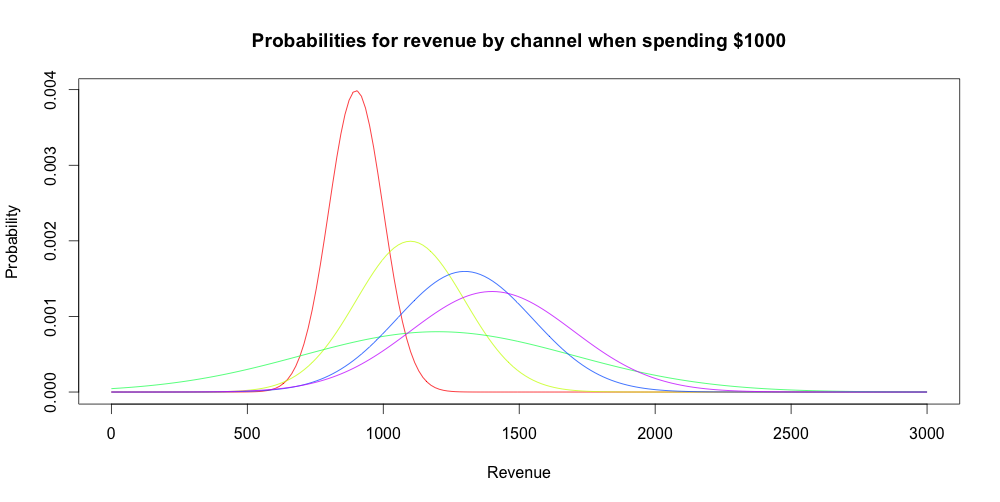
Normal distributions in which different means and standard deviations were used.
- Banners -> mean=900, sd=100
- Social Media -> mean=1100, sd=200
- Affiliate Marketing -> mean=1200, sd=500
- AdWords -> mean=1300, sd=250
- Email Marketing -> mean=1400, sd=300
Conclusion
This blog post compared advanced budget allocation strategies with naive approaches most often applied by online marketing experts. It can be seen that you get an efficients growth of 6% by just using an optimizing platform.
If you want to get details how we did this contact us.
Leave a Reply